A project chart is a visual tool used to organize project information, track tasks, monitor timelines, and understand how different activities fit together. By presenting project data in an easy-to-read format, a project chart can help teams see what needs to be done, when tasks should begin and end, and how the work is progressing toward completion.
Projects often involve multiple tasks, deadlines, milestones, team members, and dependencies. When this information is kept only in notes or long lists, it can become difficult to understand the overall picture. A visual project chart turns that information into a structured overview that is easier to review and update.
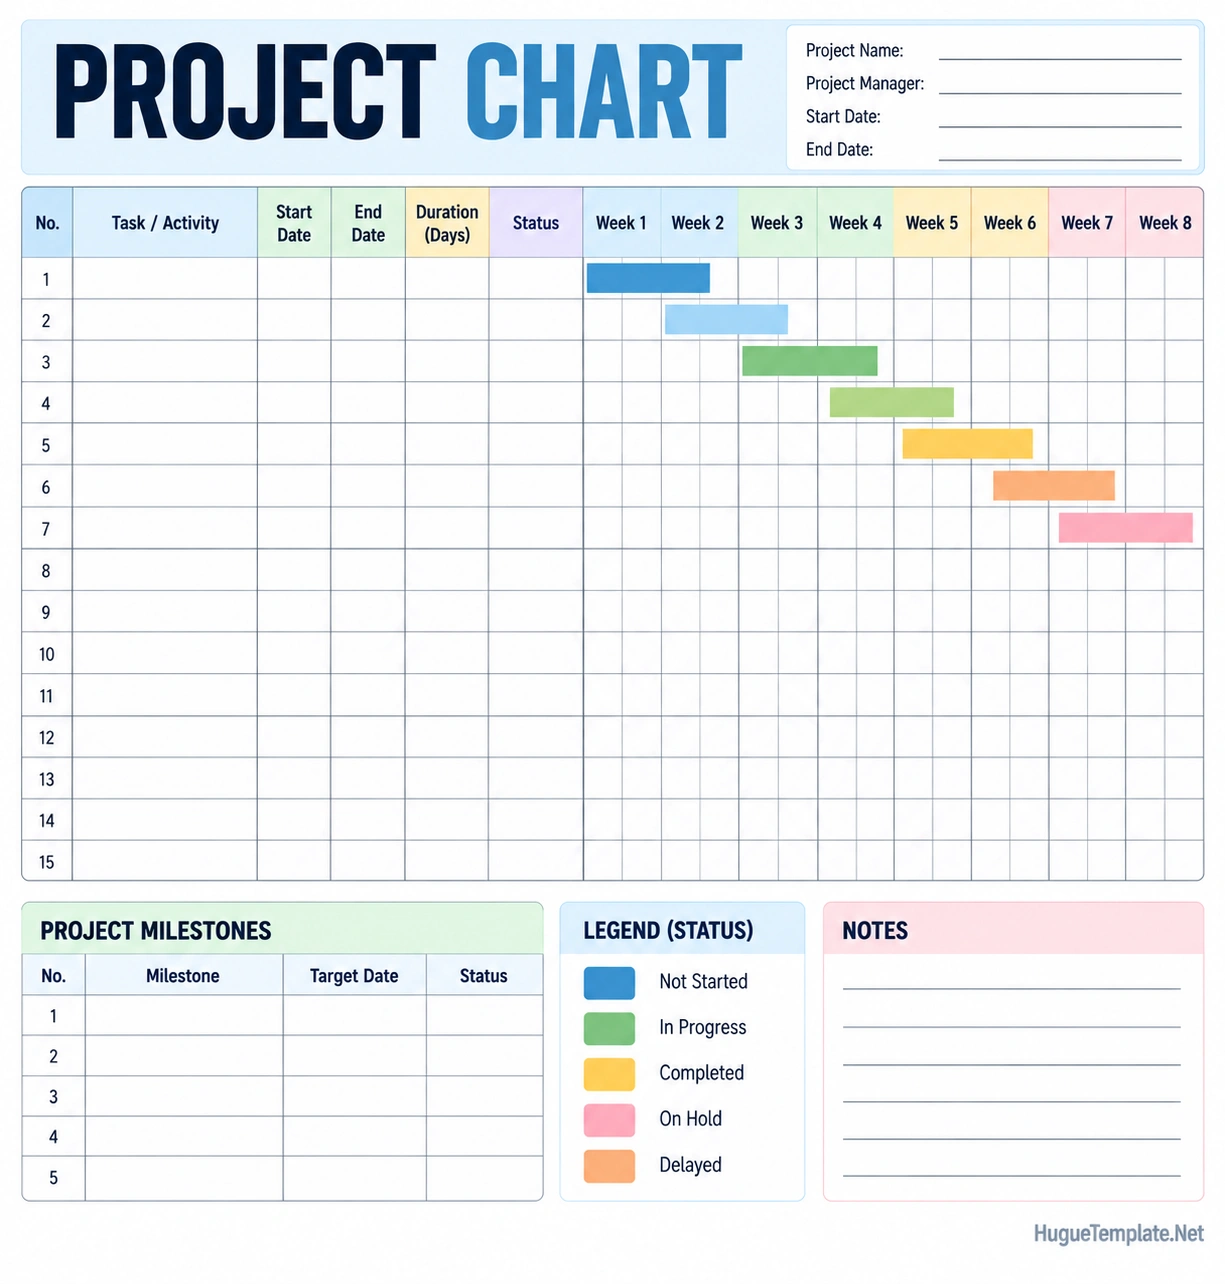
Depending on the project, a chart may show tasks, dates, durations, milestones, dependencies, status, or other important project information. A printable project chart template can provide a convenient starting point for organizing this information before or during project execution.
What Is a Project Chart?
A project chart is a visual representation of project information. It can be designed to show the schedule, tasks, milestones, responsibilities, progress, or relationships between different activities.
The format can vary depending on the type of project and the information that needs to be monitored. A simple project chart may contain a list of tasks and dates, while a more detailed chart may use a timeline or Gantt-style layout to show when activities are scheduled to take place.
The primary purpose is to make project information easier to understand at a glance. Instead of reviewing several separate documents, team members can use one visual reference to see important aspects of the project.
Why Use a Project Chart?
Project planning involves many moving parts. A project chart can help organize those elements into a structure that is easier to follow and maintain.
A well-designed chart can help project teams:
- Organize project tasks
- Set and monitor deadlines
- Track project progress
- Identify important milestones
- Understand task dependencies
- Spot potential scheduling problems
- Communicate project information clearly
- Keep team members aligned
- Monitor delayed or incomplete tasks
- Review the overall project timeline
A chart does not replace detailed project documentation, but it can provide a useful visual summary that supports day-to-day project management.
What Should a Project Chart Include?
The information included in a project chart depends on the project’s size, purpose, and management requirements. However, several fields are commonly useful.
Project Name
Start by identifying the project clearly. A project name helps distinguish the chart from other project documents and makes it easier for team members to identify the correct plan.
Task or Activity
List the activities that need to be completed. Break large activities into smaller tasks when doing so makes the project easier to plan and track.
Start Date
The planned start date indicates when a task is expected to begin. Recording start dates can help identify scheduling conflicts and establish a clear timeline.
End Date
The end date shows when a task is expected to be completed. Comparing planned end dates with actual progress can help identify delays.
Duration
Duration indicates how long a task is expected to take. It can be measured in days, weeks, or another appropriate unit depending on the project.
Status
A status field can show whether a task is not started, in progress, completed, delayed, or on hold. Consistent status labels make the chart easier to review.
Milestones
Milestones represent important points in the project, such as the completion of a major phase, approval, delivery, launch, or other significant event.
Notes
A notes section can be used to record important details, follow-up items, constraints, or information that does not fit into the main task fields.
Types of Project Charts
There are several types of charts that can be used to visualize project information. The most appropriate format depends on what the project team needs to understand.
Gantt Chart
A Gantt chart displays tasks against a timeline. Horizontal bars typically show when each task starts, how long it lasts, and when it is expected to finish.
This format is particularly useful for projects with multiple activities occurring across a defined period.
Project Timeline
A project timeline focuses on important dates and events in chronological order. It can provide a simple overview of major phases, deadlines, and milestones.
Task Tracking Chart
A task tracking chart focuses on individual activities and their current status. It may include task owners, deadlines, priorities, and completion information.
Milestone Chart
A milestone chart focuses primarily on major project achievements and target dates. It can provide a quick way to monitor whether important project stages are being reached as planned.
Work Breakdown Chart
A work breakdown chart organizes a project into smaller components. This approach can make a large project easier to understand by dividing it into phases, activities, and individual tasks.
How to Create a Project Chart
Creating a project chart does not have to be complicated. A simple process can help you build a useful visual overview.
1. Define the Project
Start by identifying the project’s objective, scope, and expected outcome. A clear understanding of the project makes it easier to determine which activities need to appear on the chart.
2. List the Major Tasks
Write down the activities required to complete the project. Include both major phases and important supporting tasks.
3. Break Large Tasks Into Smaller Activities
Large tasks can be difficult to track. Breaking them into smaller activities can make progress easier to measure and can help reveal which parts of the project require attention.
4. Add Start and End Dates
Assign planned dates to each activity. Make sure the schedule reflects the order in which the work needs to happen.
5. Identify Dependencies
Some tasks cannot begin until another task has been completed. Identify these relationships so the project schedule reflects the actual workflow.
6. Add Milestones
Mark important project events and deadlines. Milestones can help the team quickly determine whether major stages are progressing as expected.
7. Add Status Information
Use consistent status categories to show which activities are complete, underway, delayed, or waiting to begin.
8. Review the Chart
Check the completed chart for overlapping deadlines, unrealistic durations, missing tasks, and other scheduling issues before using it as a project management reference.
How a Project Chart Helps With Planning
Planning becomes easier when the entire project can be viewed in one place. A project chart allows teams to move beyond individual task lists and consider how activities fit together.
For example, if a design task must be completed before production can begin, the chart can show the relationship between those activities. This can help the team understand how a delay in one task may affect subsequent work.
A visual schedule can also make it easier to determine whether too many tasks have been scheduled within the same period.
How a Project Chart Helps With Progress Tracking
Project tracking is an ongoing process. The original schedule represents the plan, while regular updates show what is actually happening.
Teams can update the chart as work progresses by changing task statuses, recording actual completion dates, and adding notes about delays or changes.
Regular updates can help answer questions such as:
- Which tasks have been completed?
- Which tasks are currently in progress?
- Which activities have not started?
- Which tasks are behind schedule?
- Which milestones are approaching?
- Are upcoming tasks dependent on delayed activities?
Using Project Charts to Identify Bottlenecks
A bottleneck occurs when a particular activity, resource, approval, or dependency slows down the progress of other work.
A visual project schedule can make potential bottlenecks easier to identify. For example, if several tasks depend on one delayed activity, the chart can reveal the potential impact on the rest of the schedule.
Once a bottleneck is identified, the project team can evaluate possible adjustments, such as changing task priorities, reallocating resources, revising dates, or addressing the underlying dependency.
Project Chart Best Practices
A project chart is most useful when it remains clear, accurate, and up to date.
- Keep it simple: Include information that supports project planning and tracking.
- Use consistent terminology: Apply the same status labels throughout the chart.
- Break down complex work: Use manageable tasks rather than overly broad activities.
- Update regularly: Keep task status and dates current.
- Highlight milestones: Make major project events easy to identify.
- Review dependencies: Identify activities that rely on earlier work.
- Use realistic dates: Allow reasonable time for each activity.
- Share the current version: Make sure team members are working from the same project information.
Project Chart Template Benefits
A project chart template provides a predefined structure for organizing project information. Instead of designing a chart from the beginning, users can start with fields for tasks, dates, status, milestones, and notes.
A printable template can be especially useful during planning meetings, project reviews, or physical work sessions where team members prefer to write information by hand.
For larger projects, the same basic structure can also serve as the foundation for a digital project management system.
Common Project Chart Mistakes
Even a well-designed chart can become ineffective if it is not maintained properly. Avoid these common problems:
- Including too much unnecessary information
- Using vague task descriptions
- Creating unrealistic deadlines
- Ignoring task dependencies
- Failing to update completed tasks
- Not identifying important milestones
- Using inconsistent status labels
- Maintaining multiple conflicting versions of the chart
- Failing to communicate schedule changes
The goal is not to create the most complicated chart possible. The goal is to create a clear visual reference that helps people understand and manage the project.
Project Chart Checklist
Before using a project chart, review the following checklist:
- Project name is clearly identified
- Major tasks are listed
- Tasks are divided into manageable activities
- Start dates are included
- End dates are included
- Task durations are reasonable
- Dependencies have been identified
- Major milestones are included
- Status categories are clearly defined
- Important notes are recorded
- The schedule has been reviewed for conflicts
- The chart has a process for regular updates
Frequently Asked Questions About Project Charts
What is a project chart?
A project chart is a visual tool that organizes project information such as tasks, schedules, milestones, dependencies, and status. It helps teams understand the project timeline and monitor progress.
What is the purpose of a project chart?
The purpose of a project chart is to provide a clear visual overview of project activities and schedules. It can help with planning, tracking, communication, and identifying potential scheduling issues.
What should a project chart include?
A project chart can include the project name, task or activity, start date, end date, duration, status, milestones, dependencies, and notes. The exact fields can be customized to suit the project.
Is a project chart the same as a Gantt chart?
Not necessarily. A Gantt chart is one type of project chart that displays activities against a timeline. The term project chart can describe several different visual formats for organizing and tracking project information.
How often should a project chart be updated?
The chart should be updated often enough to accurately reflect project progress. For active projects, updates may be made during regular project reviews or whenever significant changes occur.
Can I use a project chart template for any project?
A general project chart template can be adapted to many types of projects. However, the fields, timeline, task structure, and tracking requirements should be customized to match the project’s specific needs.
Conclusion
A project chart provides a simple visual way to organize tasks, timelines, milestones, dependencies, and project status. By putting important project information into a structured format, teams can more easily understand what needs to happen and when.
Whether you use a Gantt-style chart, project timeline, task tracker, or printable project chart template, the most important factor is keeping the information clear and current. A well-maintained chart can support better planning, improve communication, make delays easier to identify, and give the team a shared view of project progress.
For the best results, choose a chart format that matches the complexity of your project and update it regularly as the work develops. The chart should make project management easier rather than adding unnecessary complexity.
Download: Project Chart Template
