Gantt charts are a powerful tool in project management for visually representing a project’s timeline. They provide a clear overview of tasks, dependencies, and deadlines, making it easier for teams to plan, track, and manage projects effectively. Whether you’re a project manager, team leader, or just someone interested in project management, understanding how to use and create Gantt charts can significantly improve your project planning skills.
In this comprehensive guide, we will explore everything you need to know about Gantt charts, from what they are and why they are important to how to create one and useful tips for maximizing their benefits.
What is a Gantt Chart?
A Gantt chart is a visual representation of a project schedule that shows the start and finish dates of various project elements. It is named after Henry Gantt, an American engineer and management consultant who first introduced this tool in the 1910s. The chart consists of horizontal bars representing different tasks or activities, with their lengths corresponding to the duration of each task. Gantt charts also display dependencies between tasks, milestones, and deadlines, allowing project managers to easily track progress and make adjustments as needed.
Gantt charts are commonly used in industries such as construction, engineering, information technology, and marketing, where projects involve multiple tasks that need to be completed within specific timeframes. They provide a visual roadmap for the entire project, helping team members understand their roles and responsibilities, prioritize tasks, and stay on track to meet project deadlines.
Why are Gantt Charts Important?
Gantt charts offer several benefits that make them an essential tool in project management. Some of the key reasons why Gantt charts are important include:
– Visual Representation: Gantt charts provide a visual representation of the project schedule, making it easy for team members to understand the timeline and dependencies between tasks.
– Resource Allocation: By clearly outlining tasks and timelines, Gantt charts help project managers allocate resources efficiently and avoid overloading team members.
– Deadline Management: Gantt charts help teams stay on track with project deadlines by highlighting critical milestones and task dependencies.
– Communication Tool: Gantt charts serve as a communication tool for project stakeholders, allowing them to easily view project progress and make informed decisions.
– Risk Management: Gantt charts enable project managers to identify potential risks and bottlenecks in the project schedule, allowing them to proactively address issues before they become major problems.
What to Include in a Gantt Chart
When creating a Gantt chart, there are several key elements that you should include to ensure its effectiveness in project management. These elements include:
– Task List: A list of all tasks or activities required to complete the project.
– Duration: The estimated duration of each task, represented by the length of the corresponding bar on the chart.
– Dependencies: The relationships between tasks, indicating which tasks must be completed before others can start.
– Milestones: Significant points in the project timeline, such as deadlines, deliverables, or key events.
– Resources: The team members or resources assigned to each task.
– Progress Tracking: A mechanism for tracking task progress, such as percentage completion or actual vs. planned dates.
Including these elements in your Gantt chart will help you create a clear and comprehensive project schedule that can be easily understood and managed by your team.
Examples
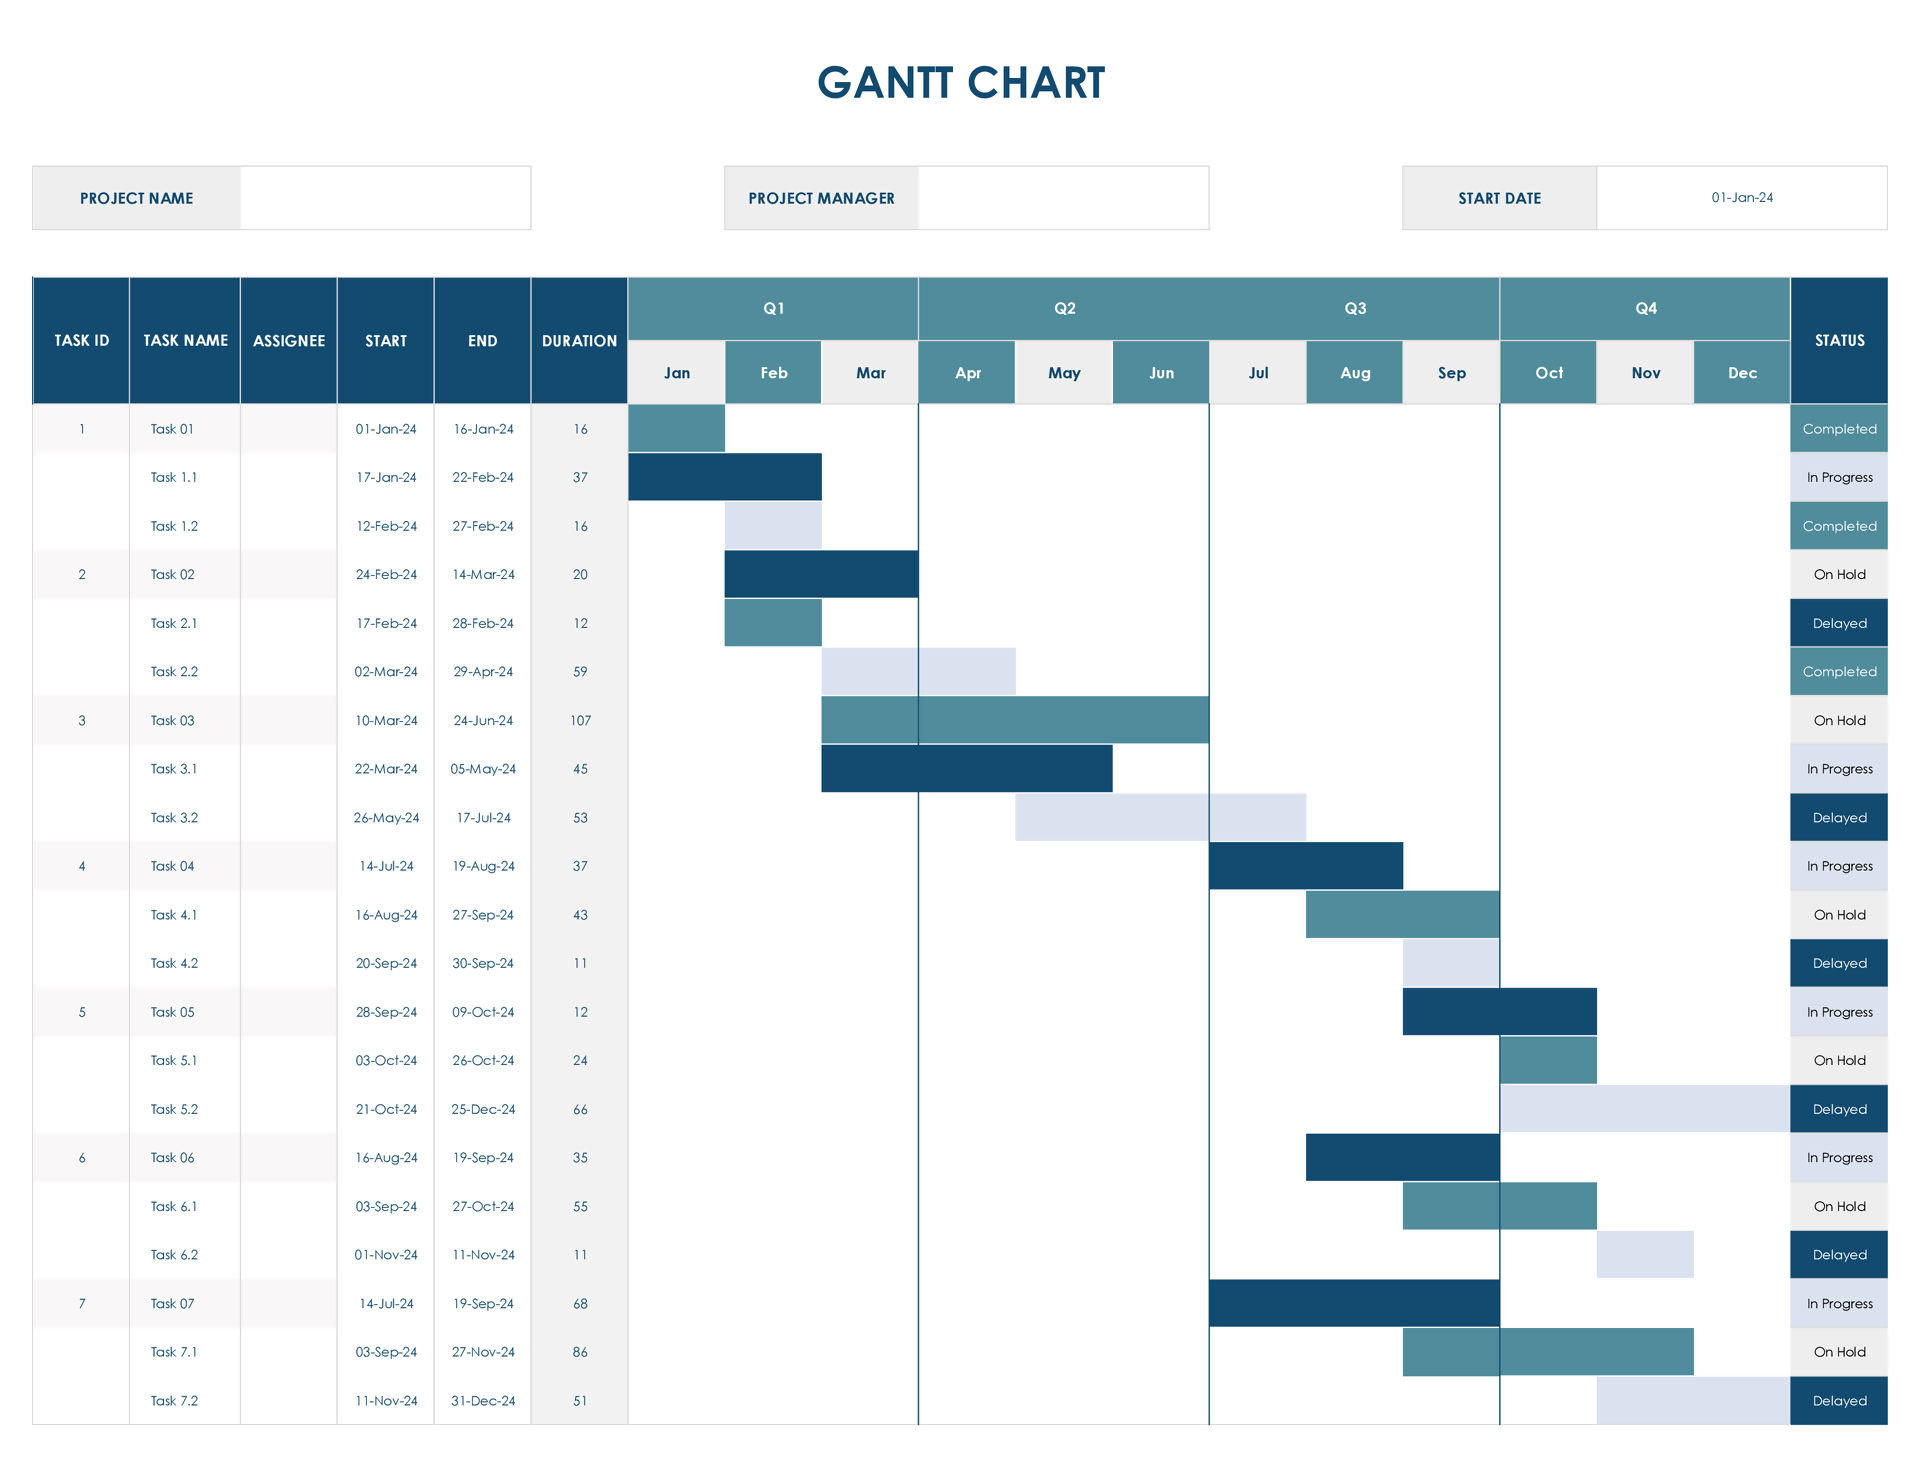
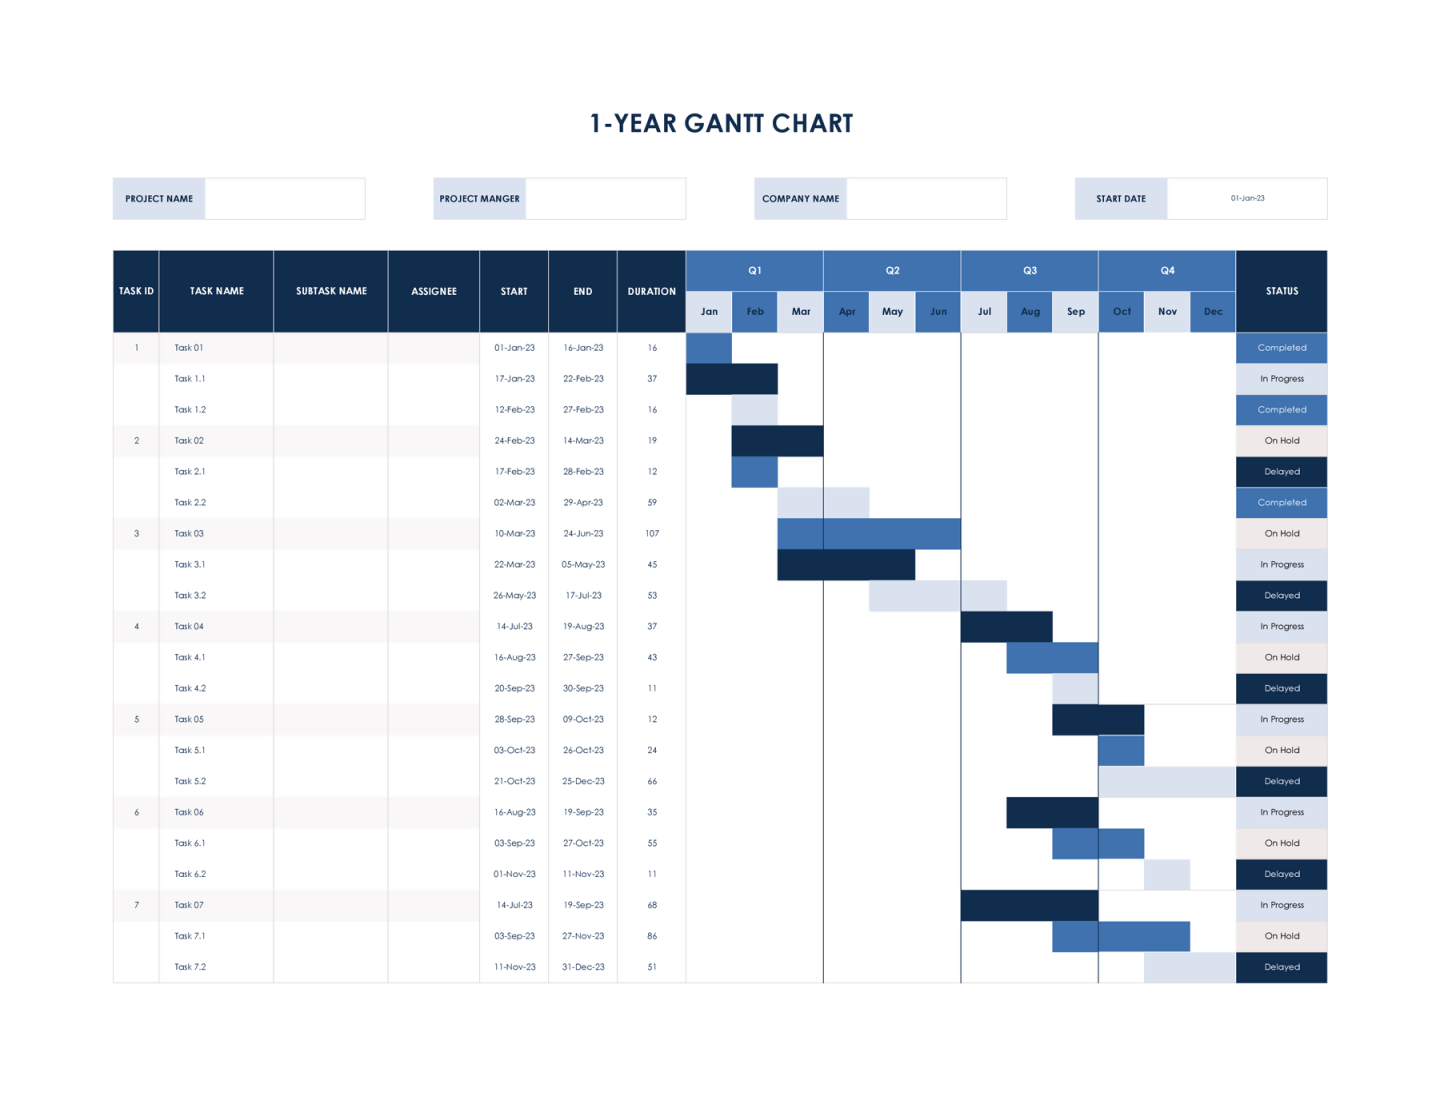
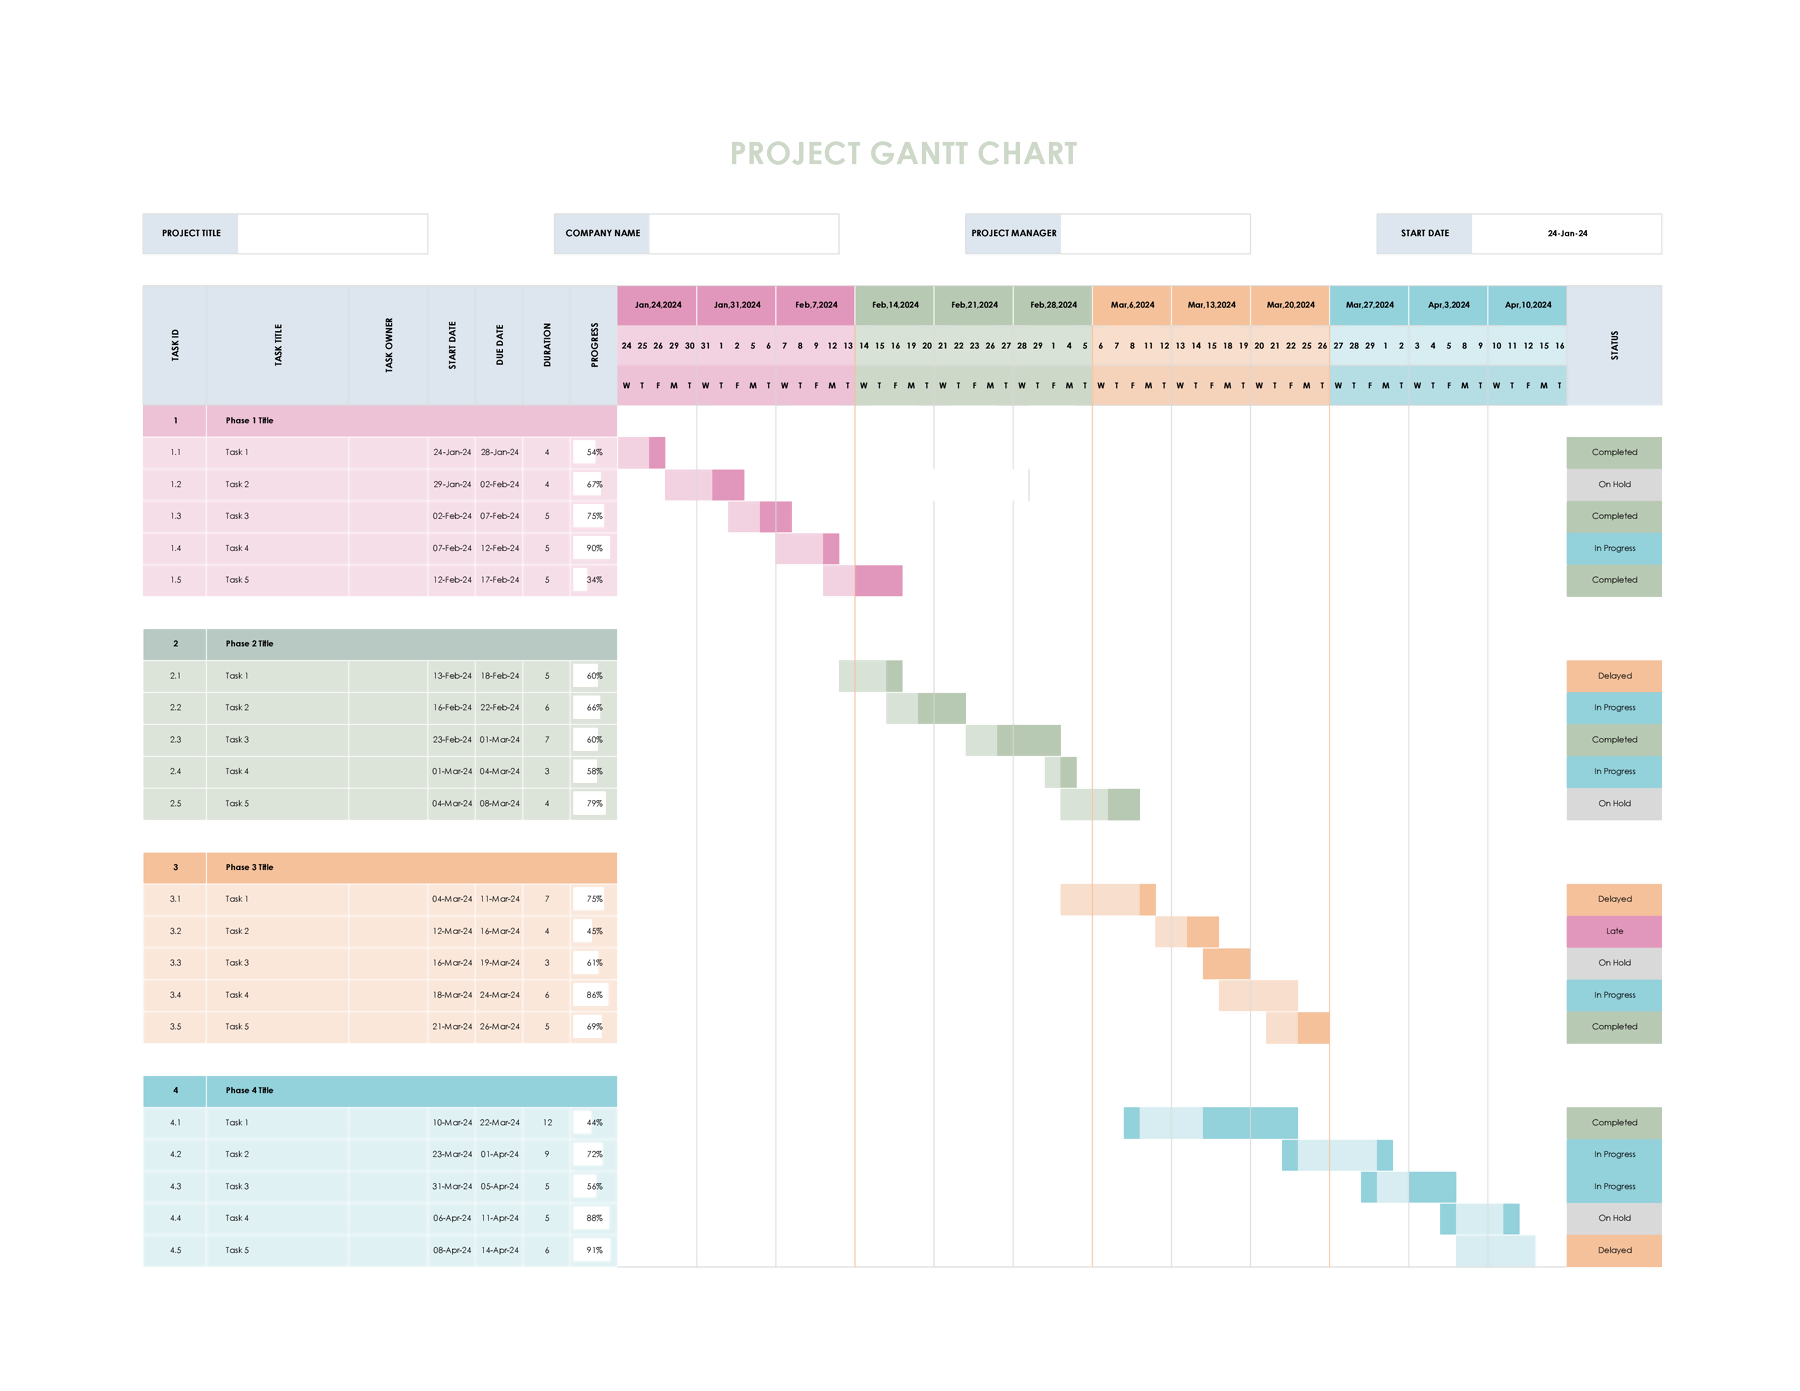
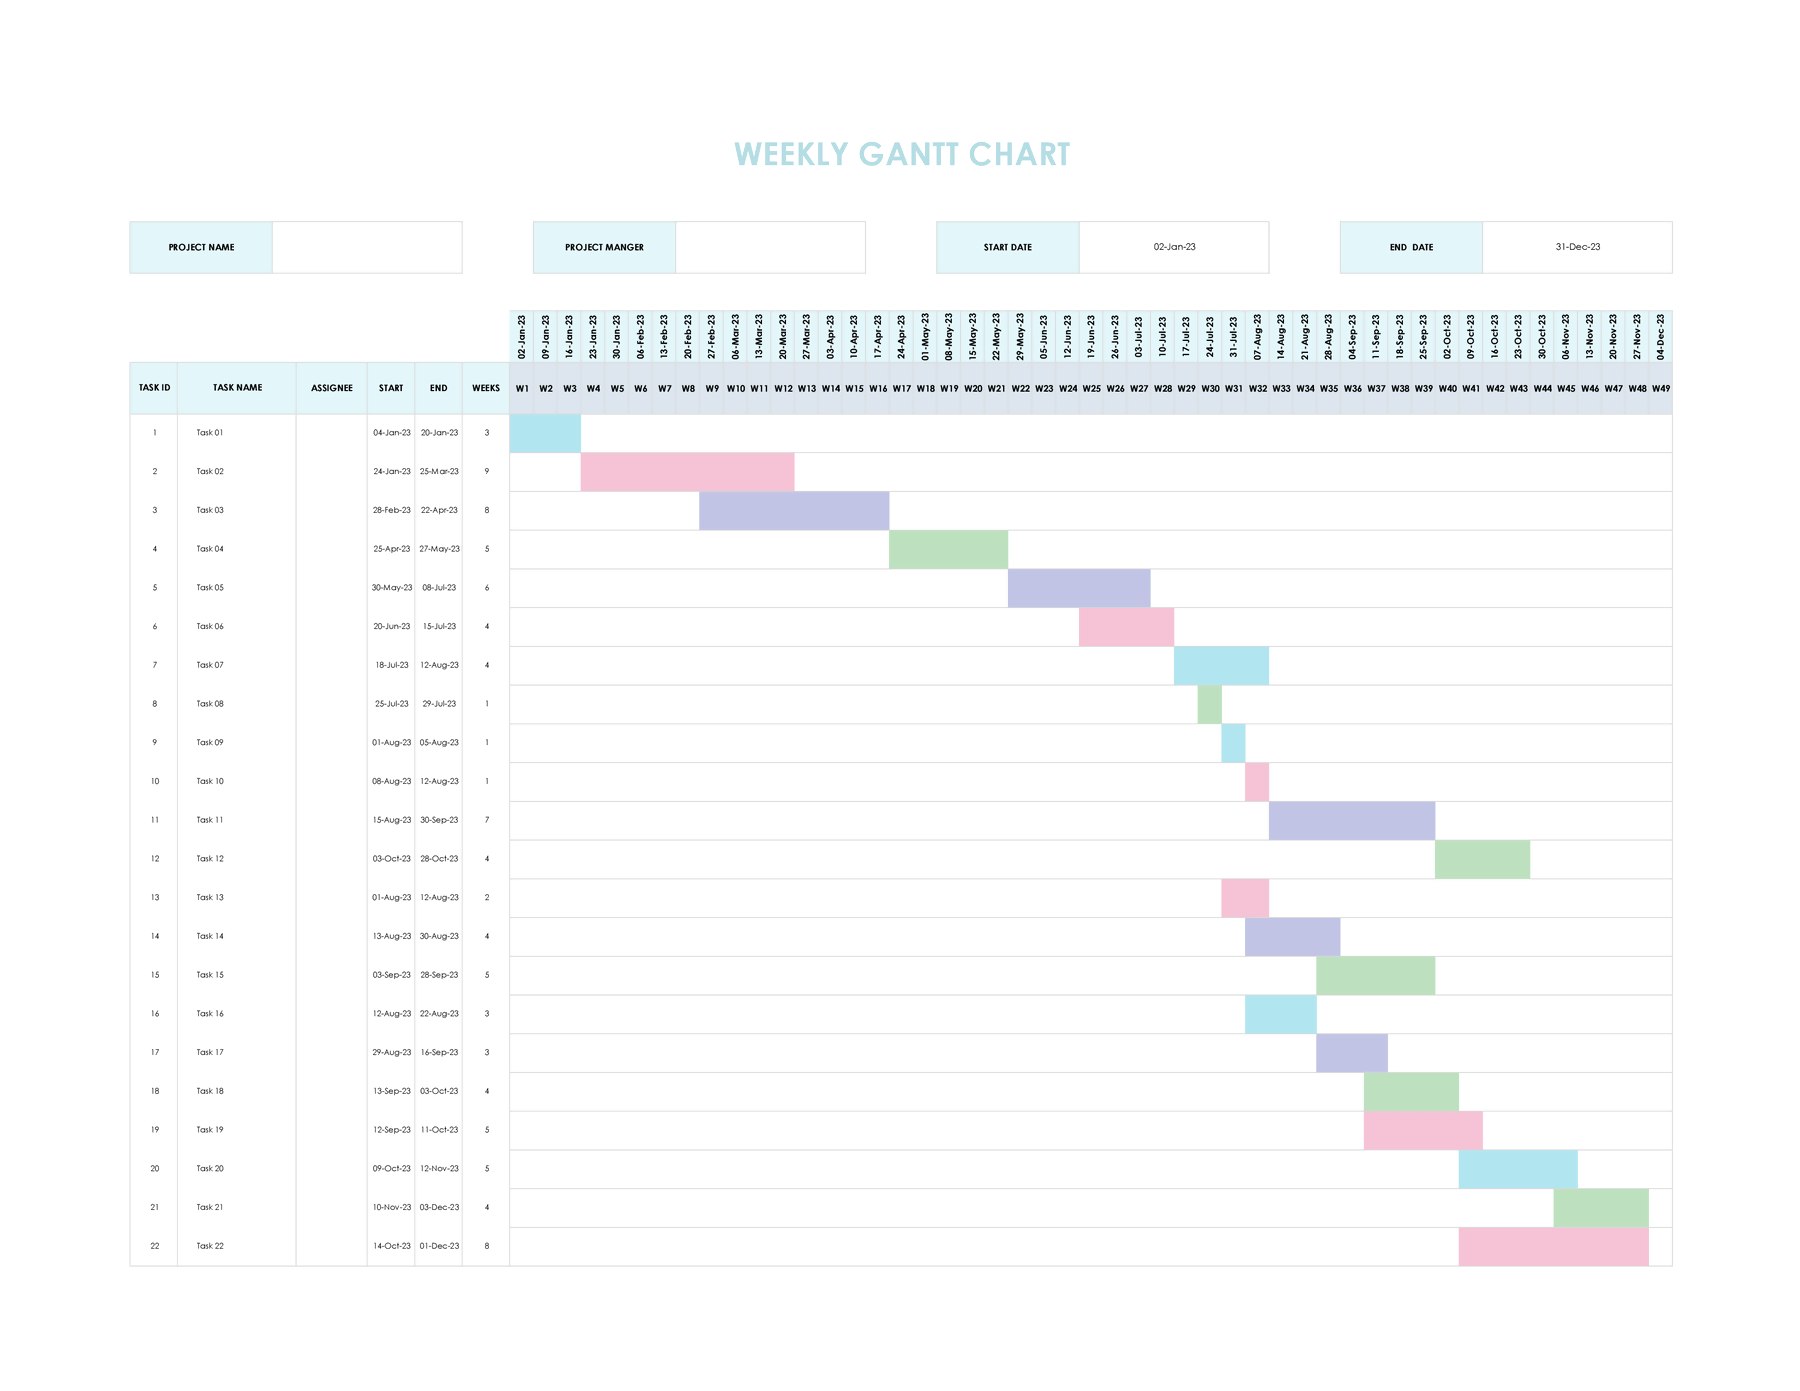
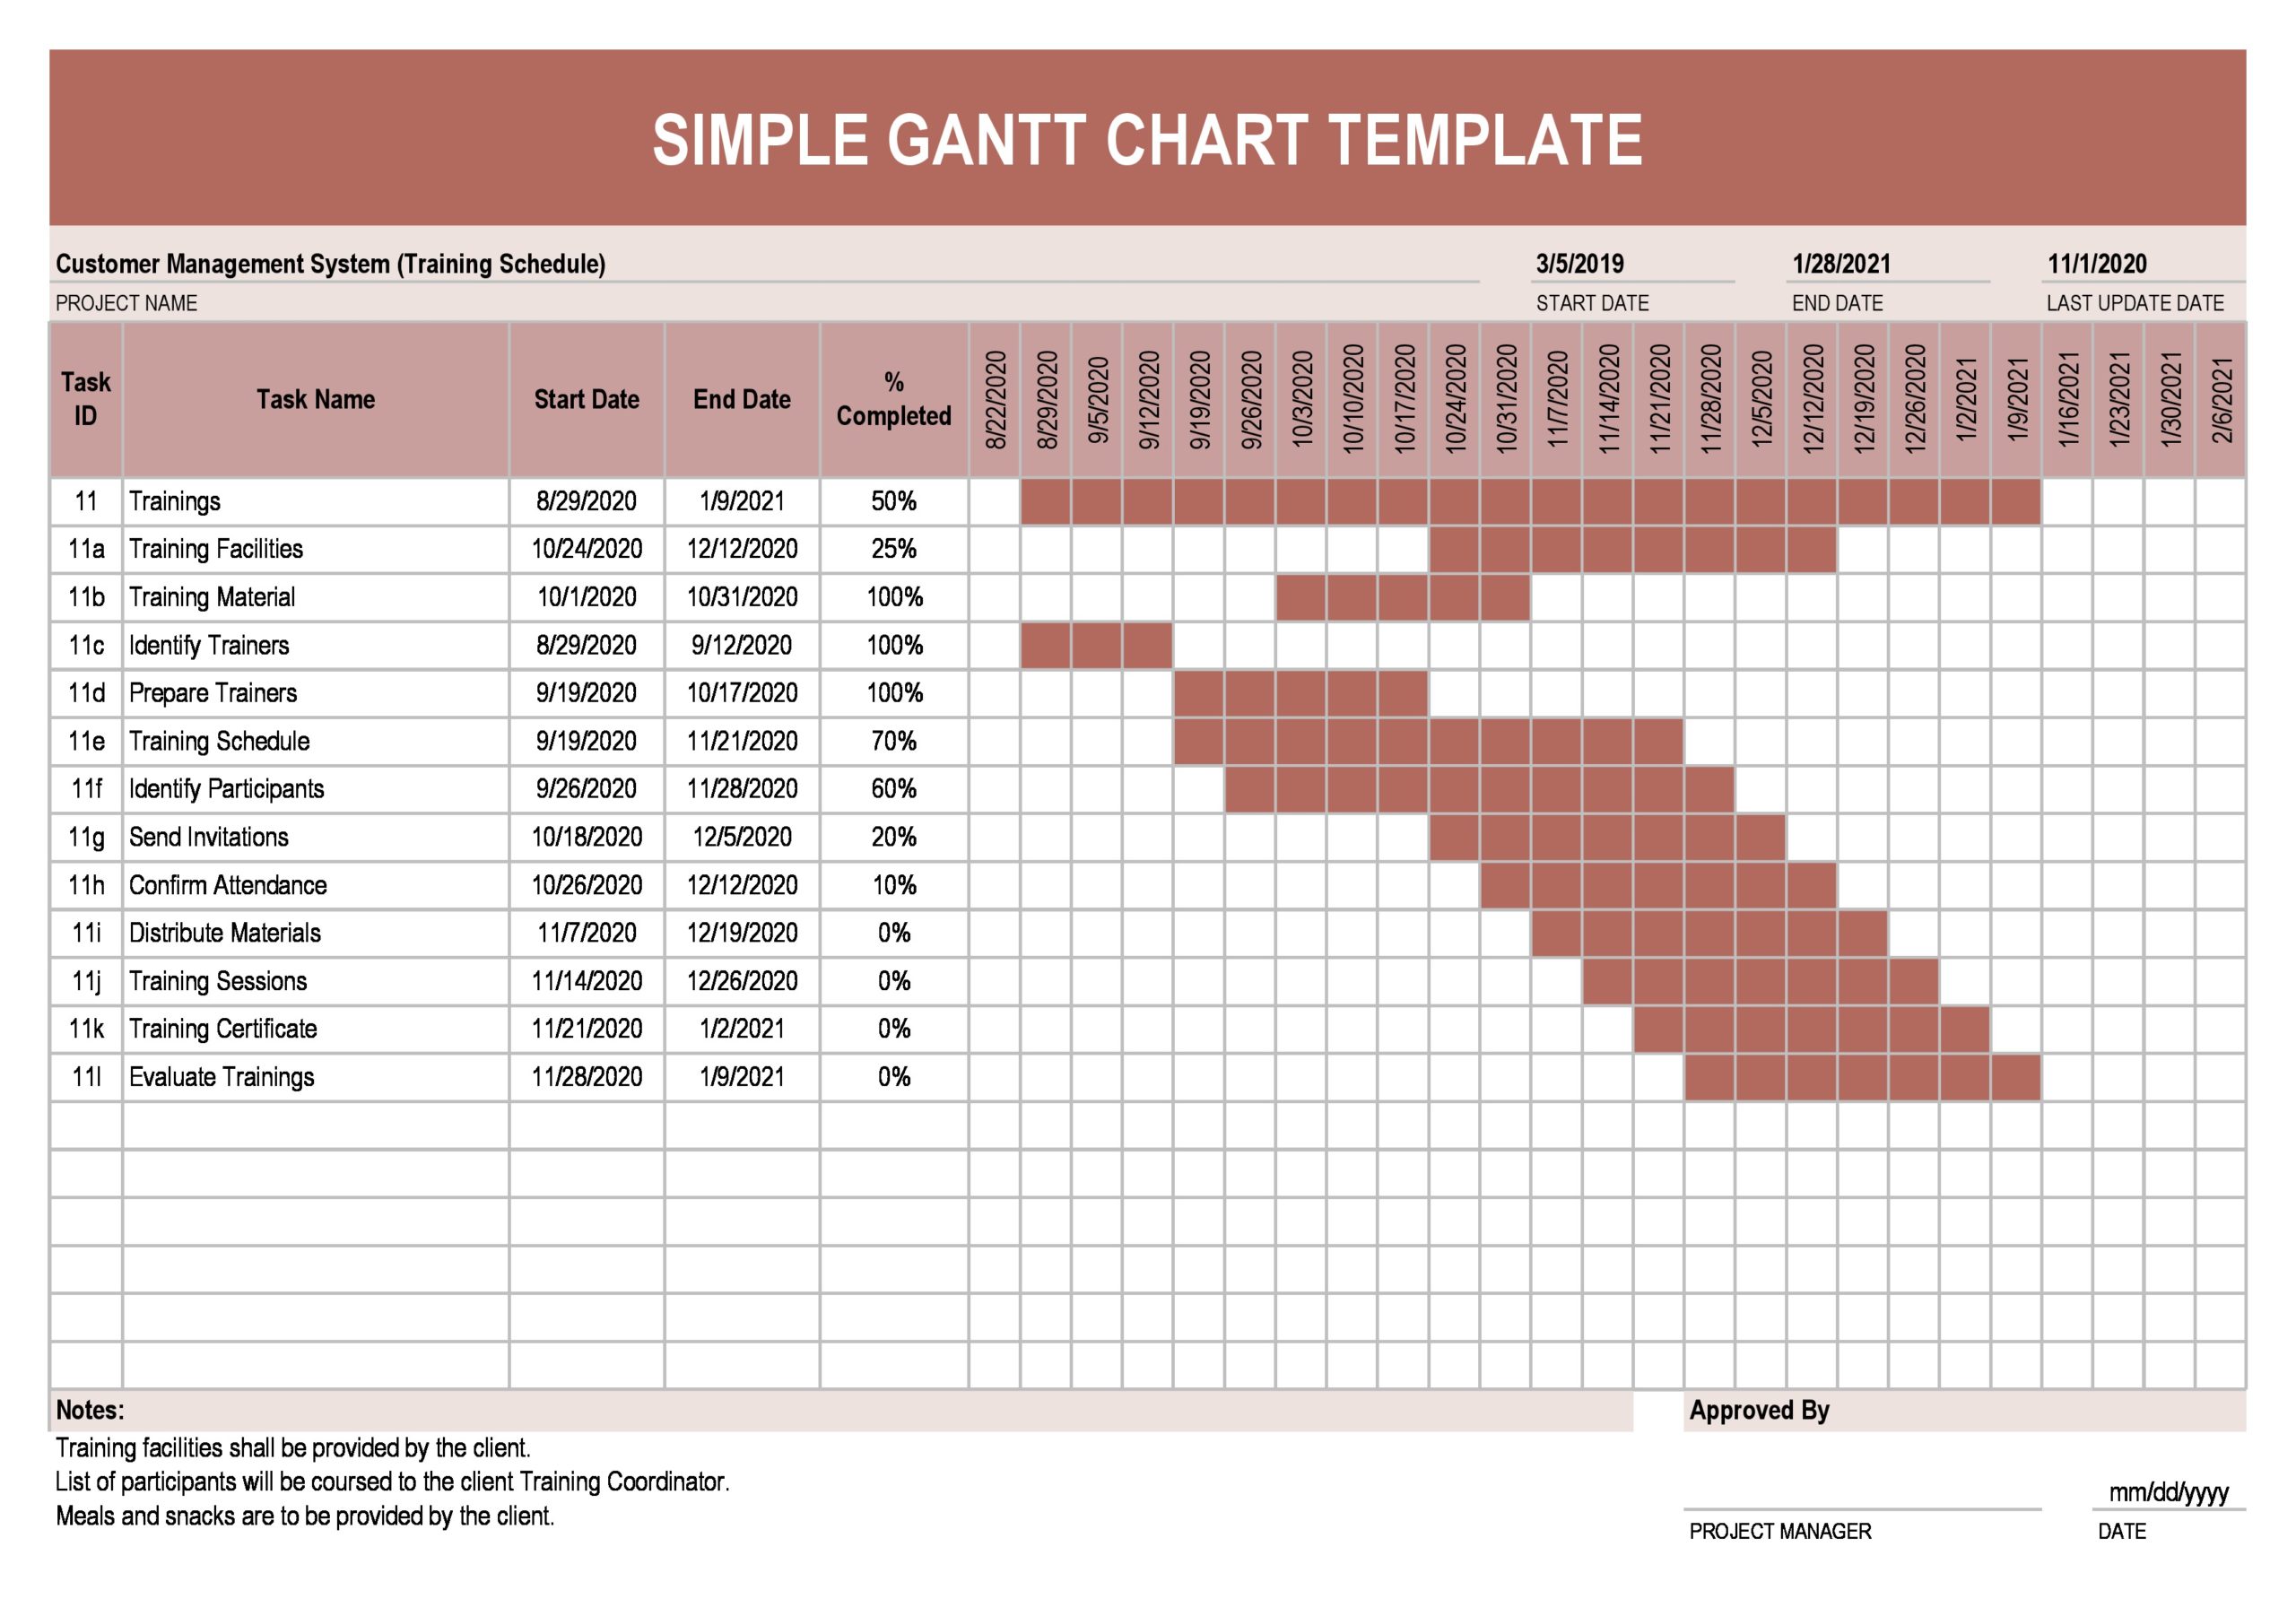
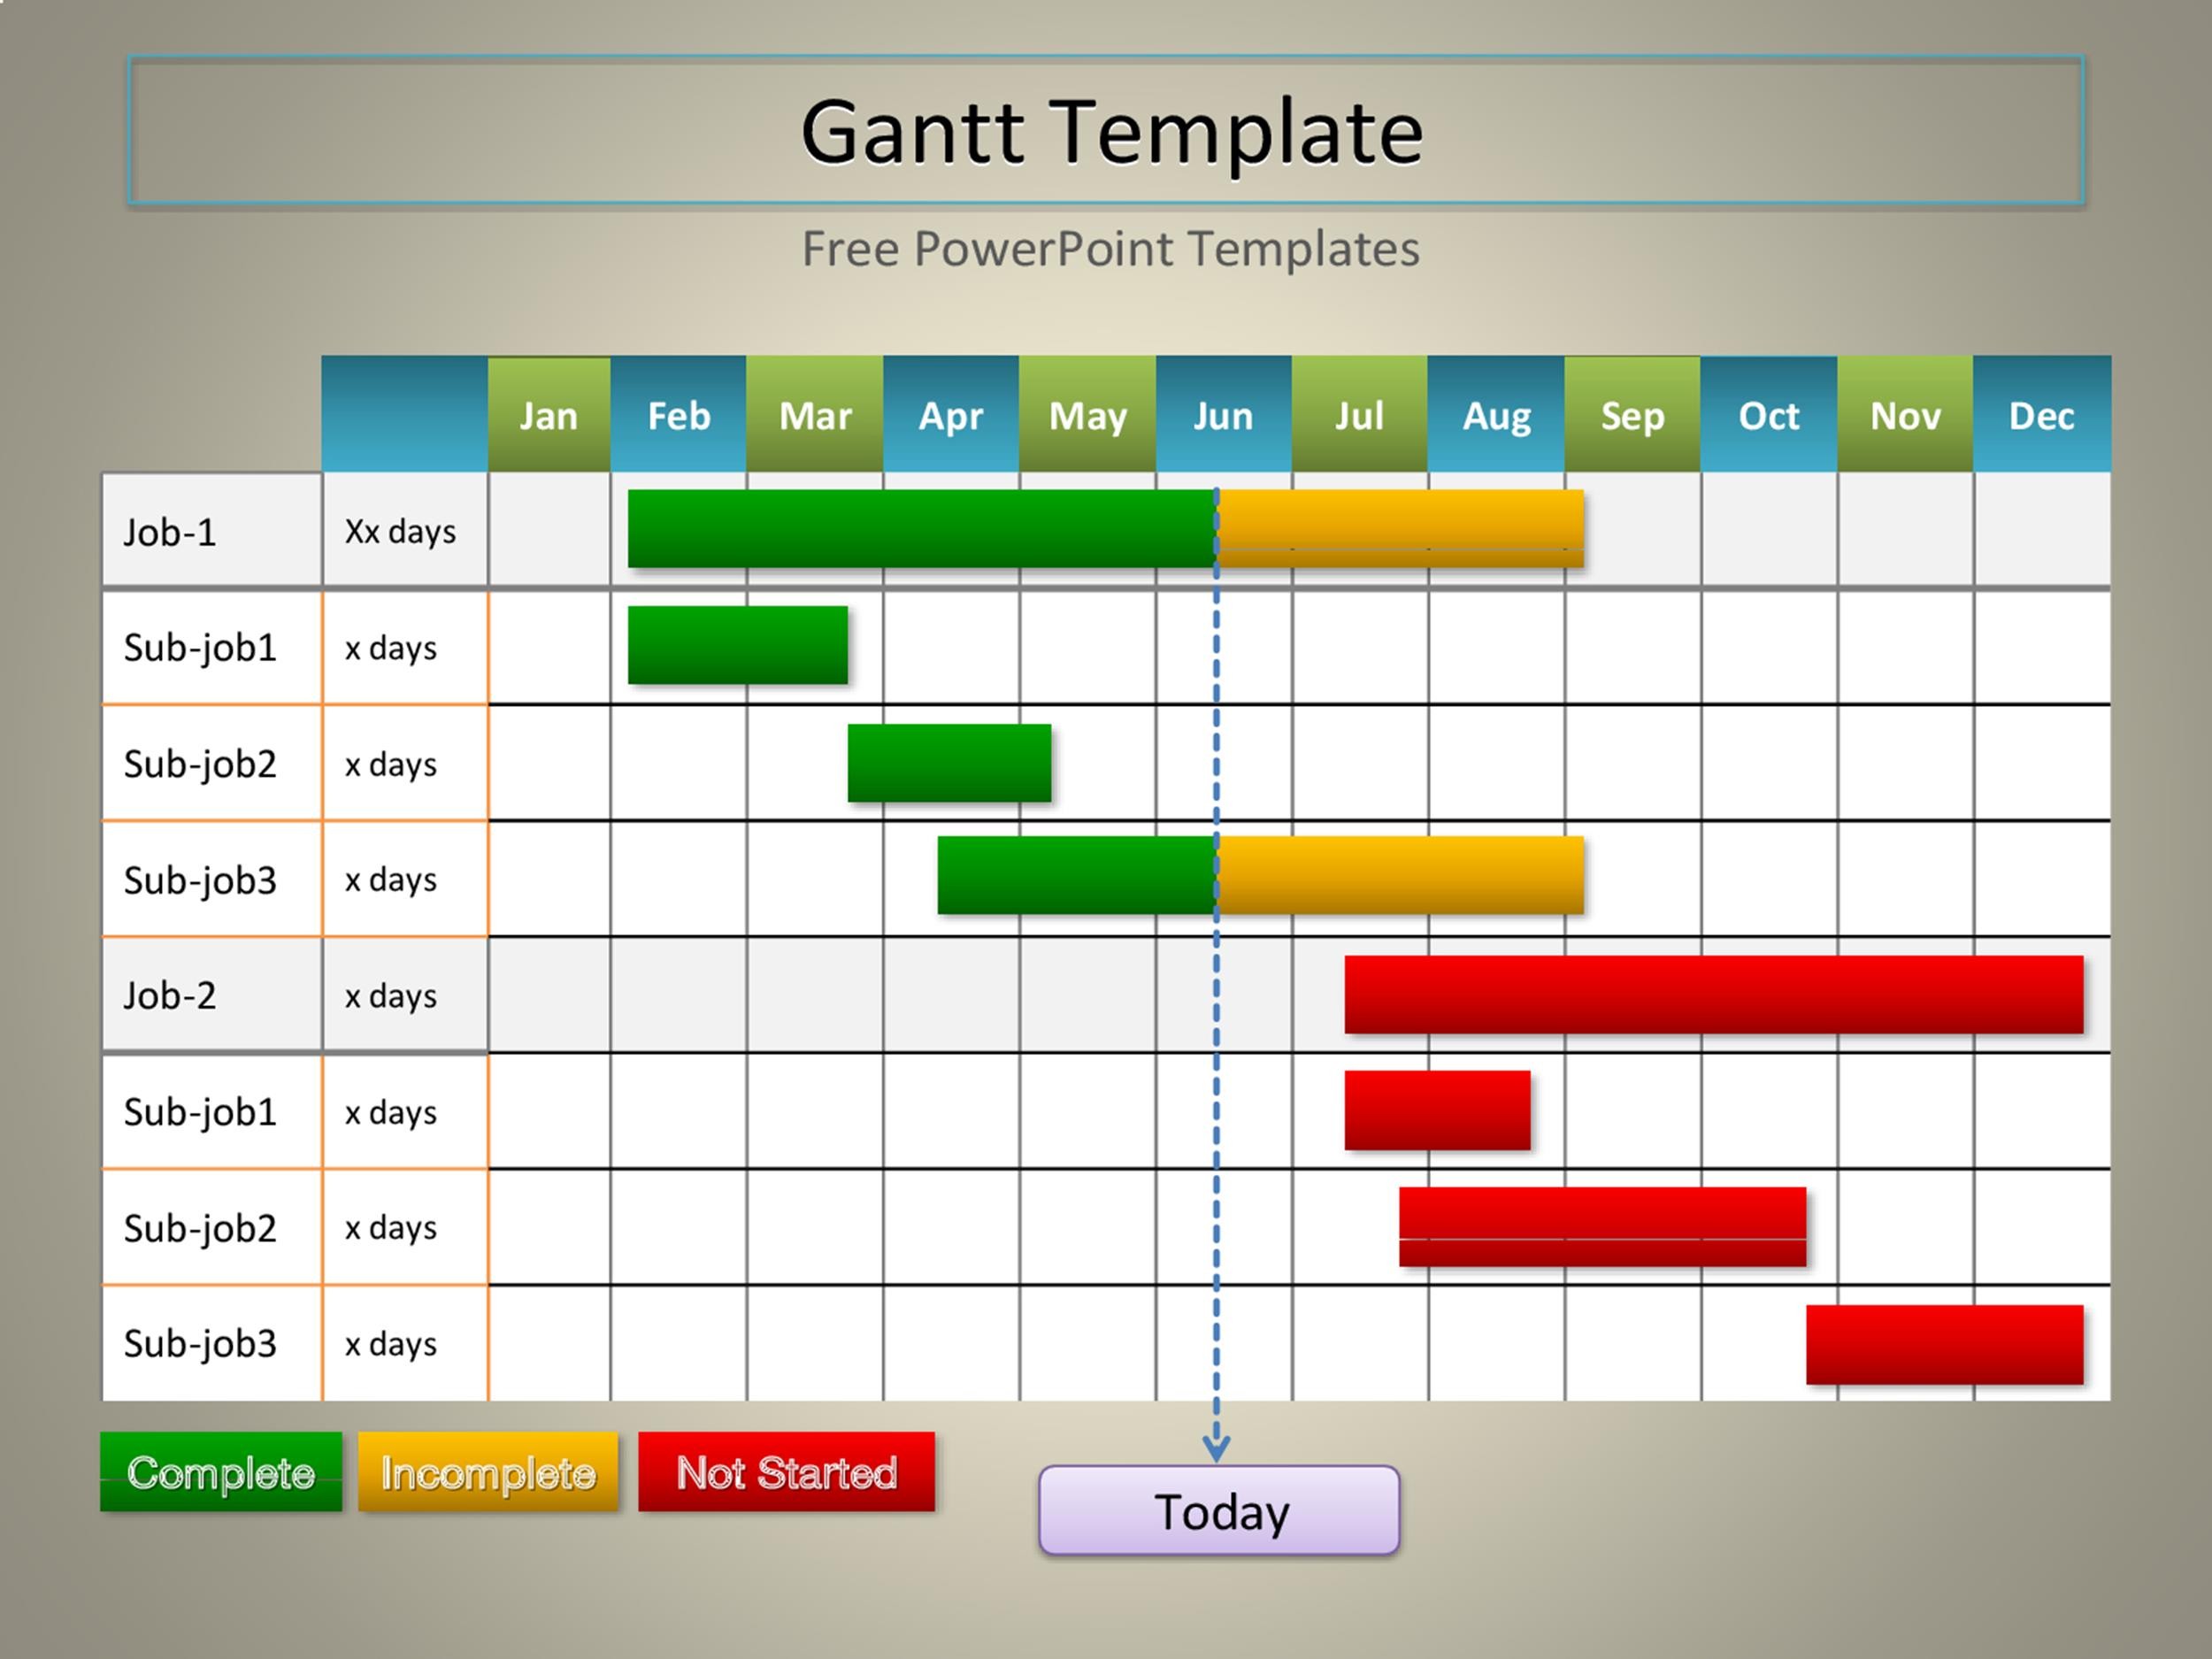
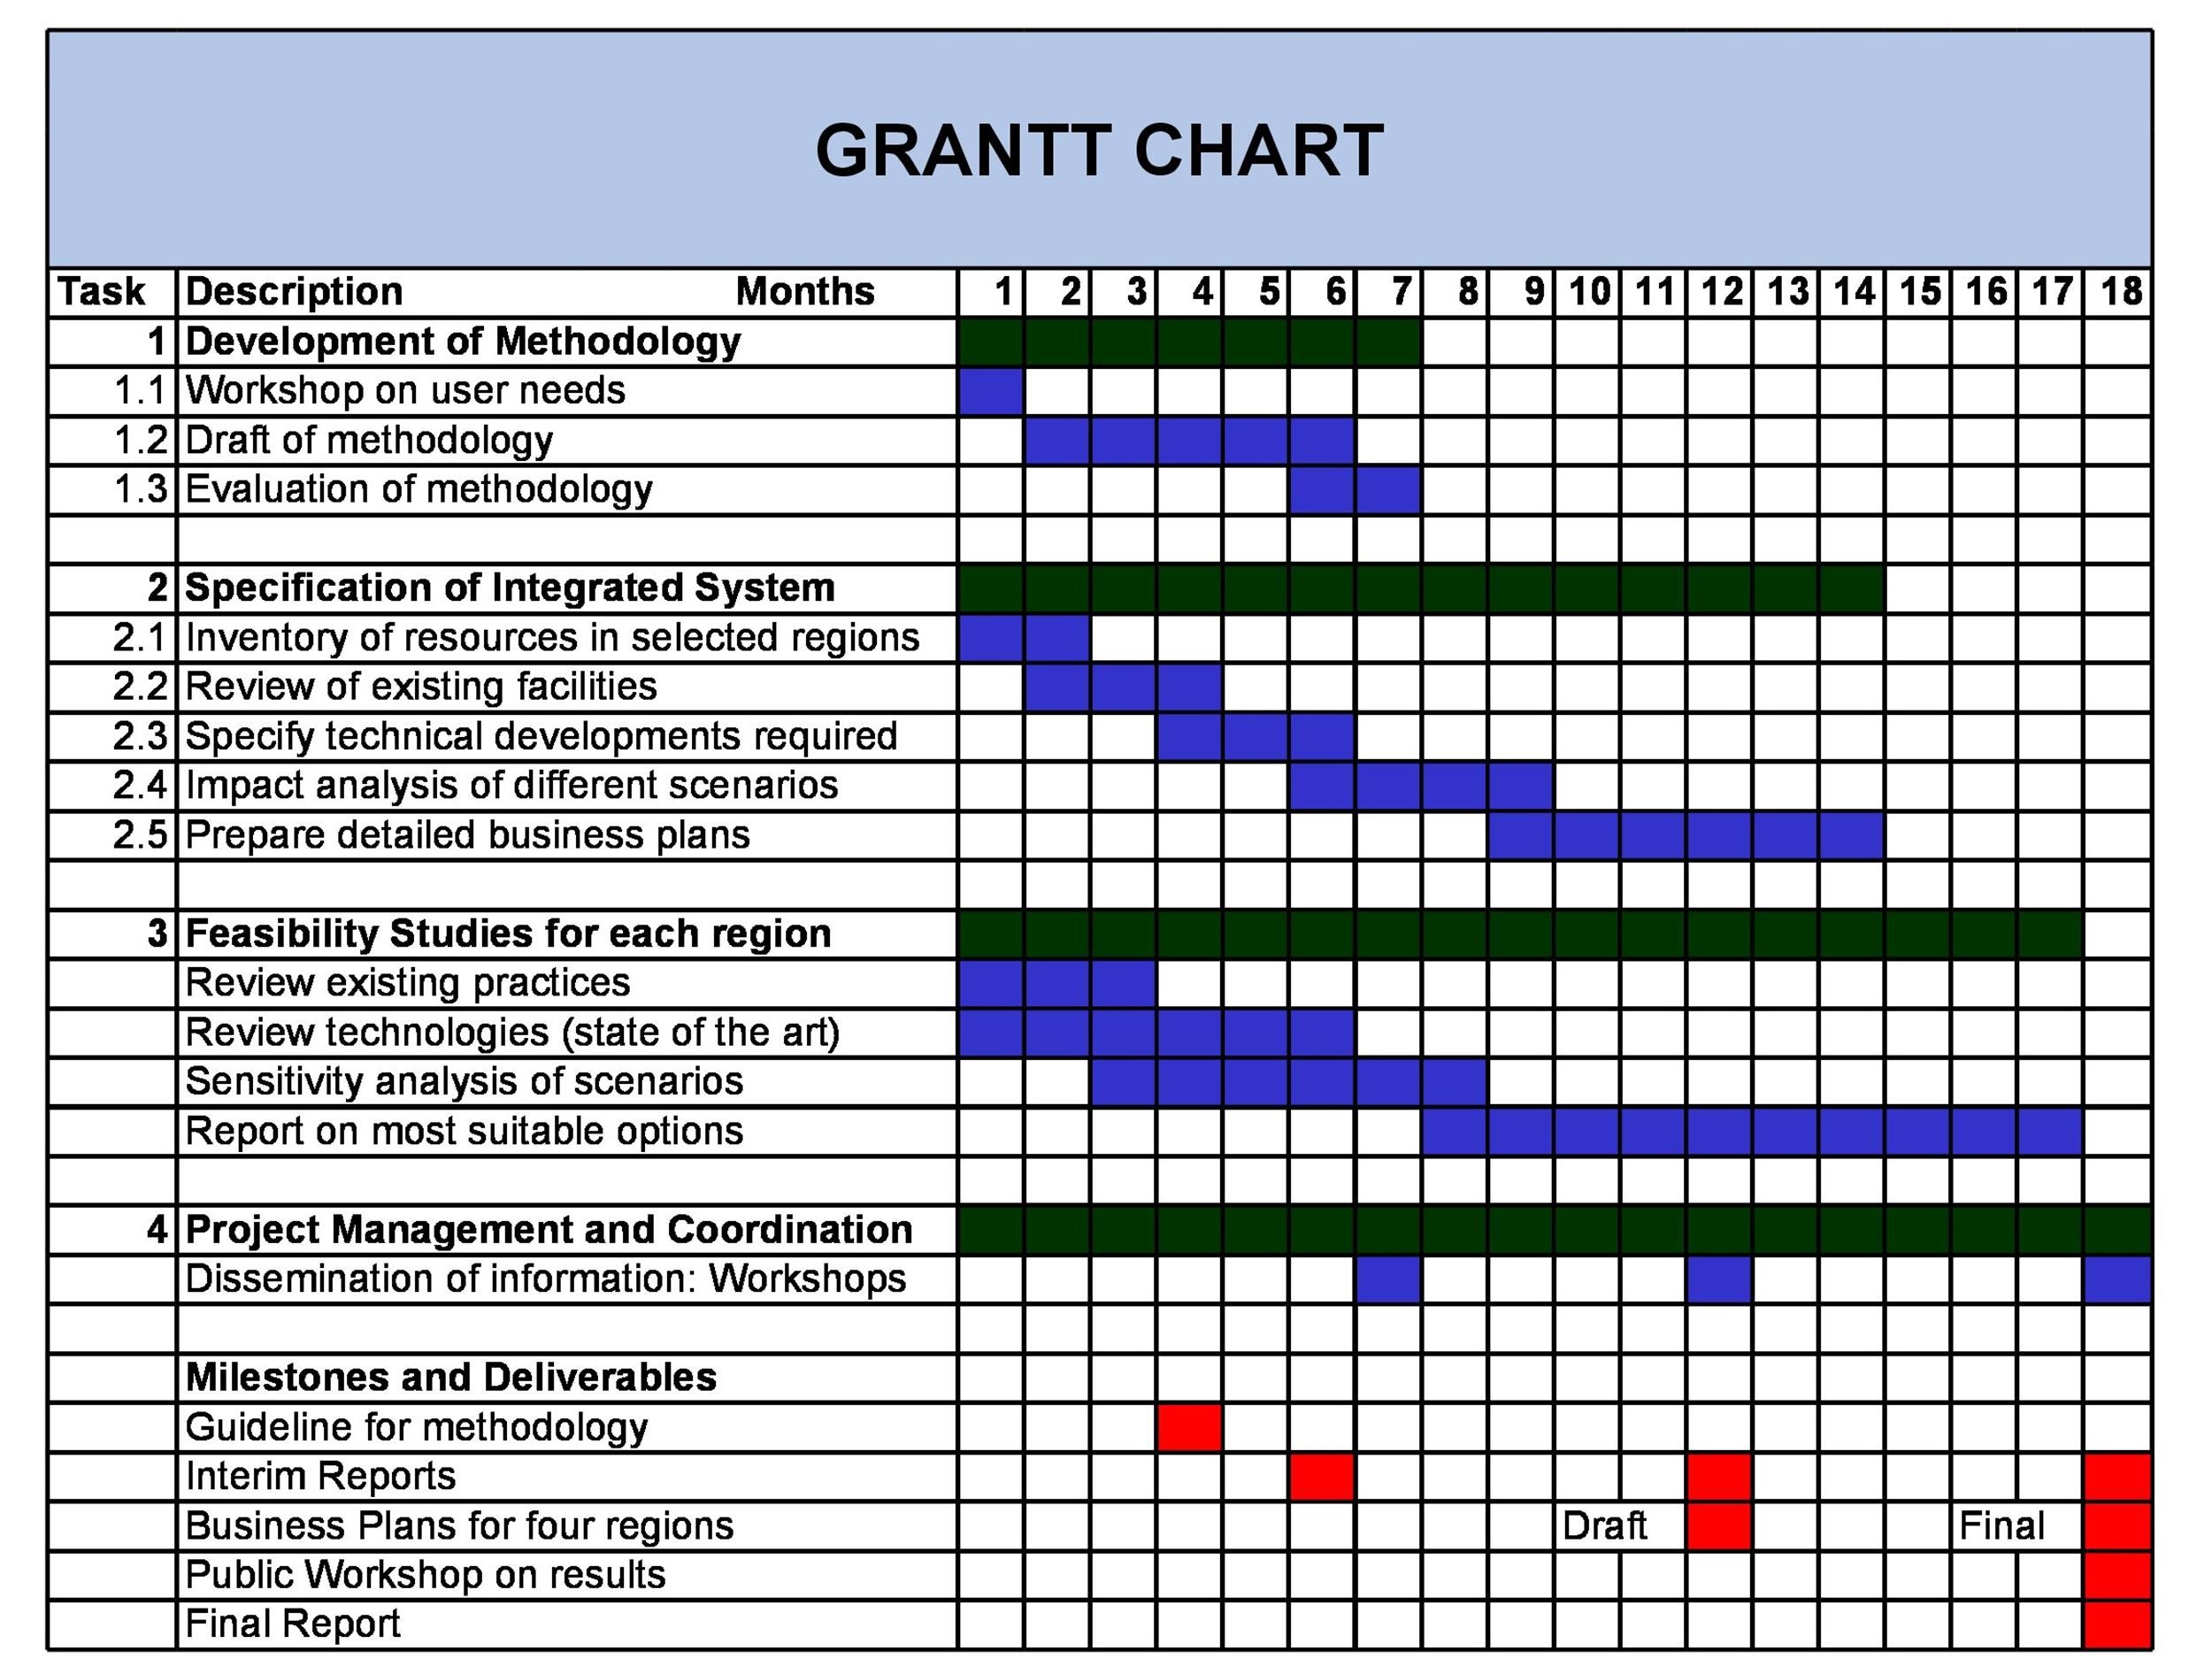
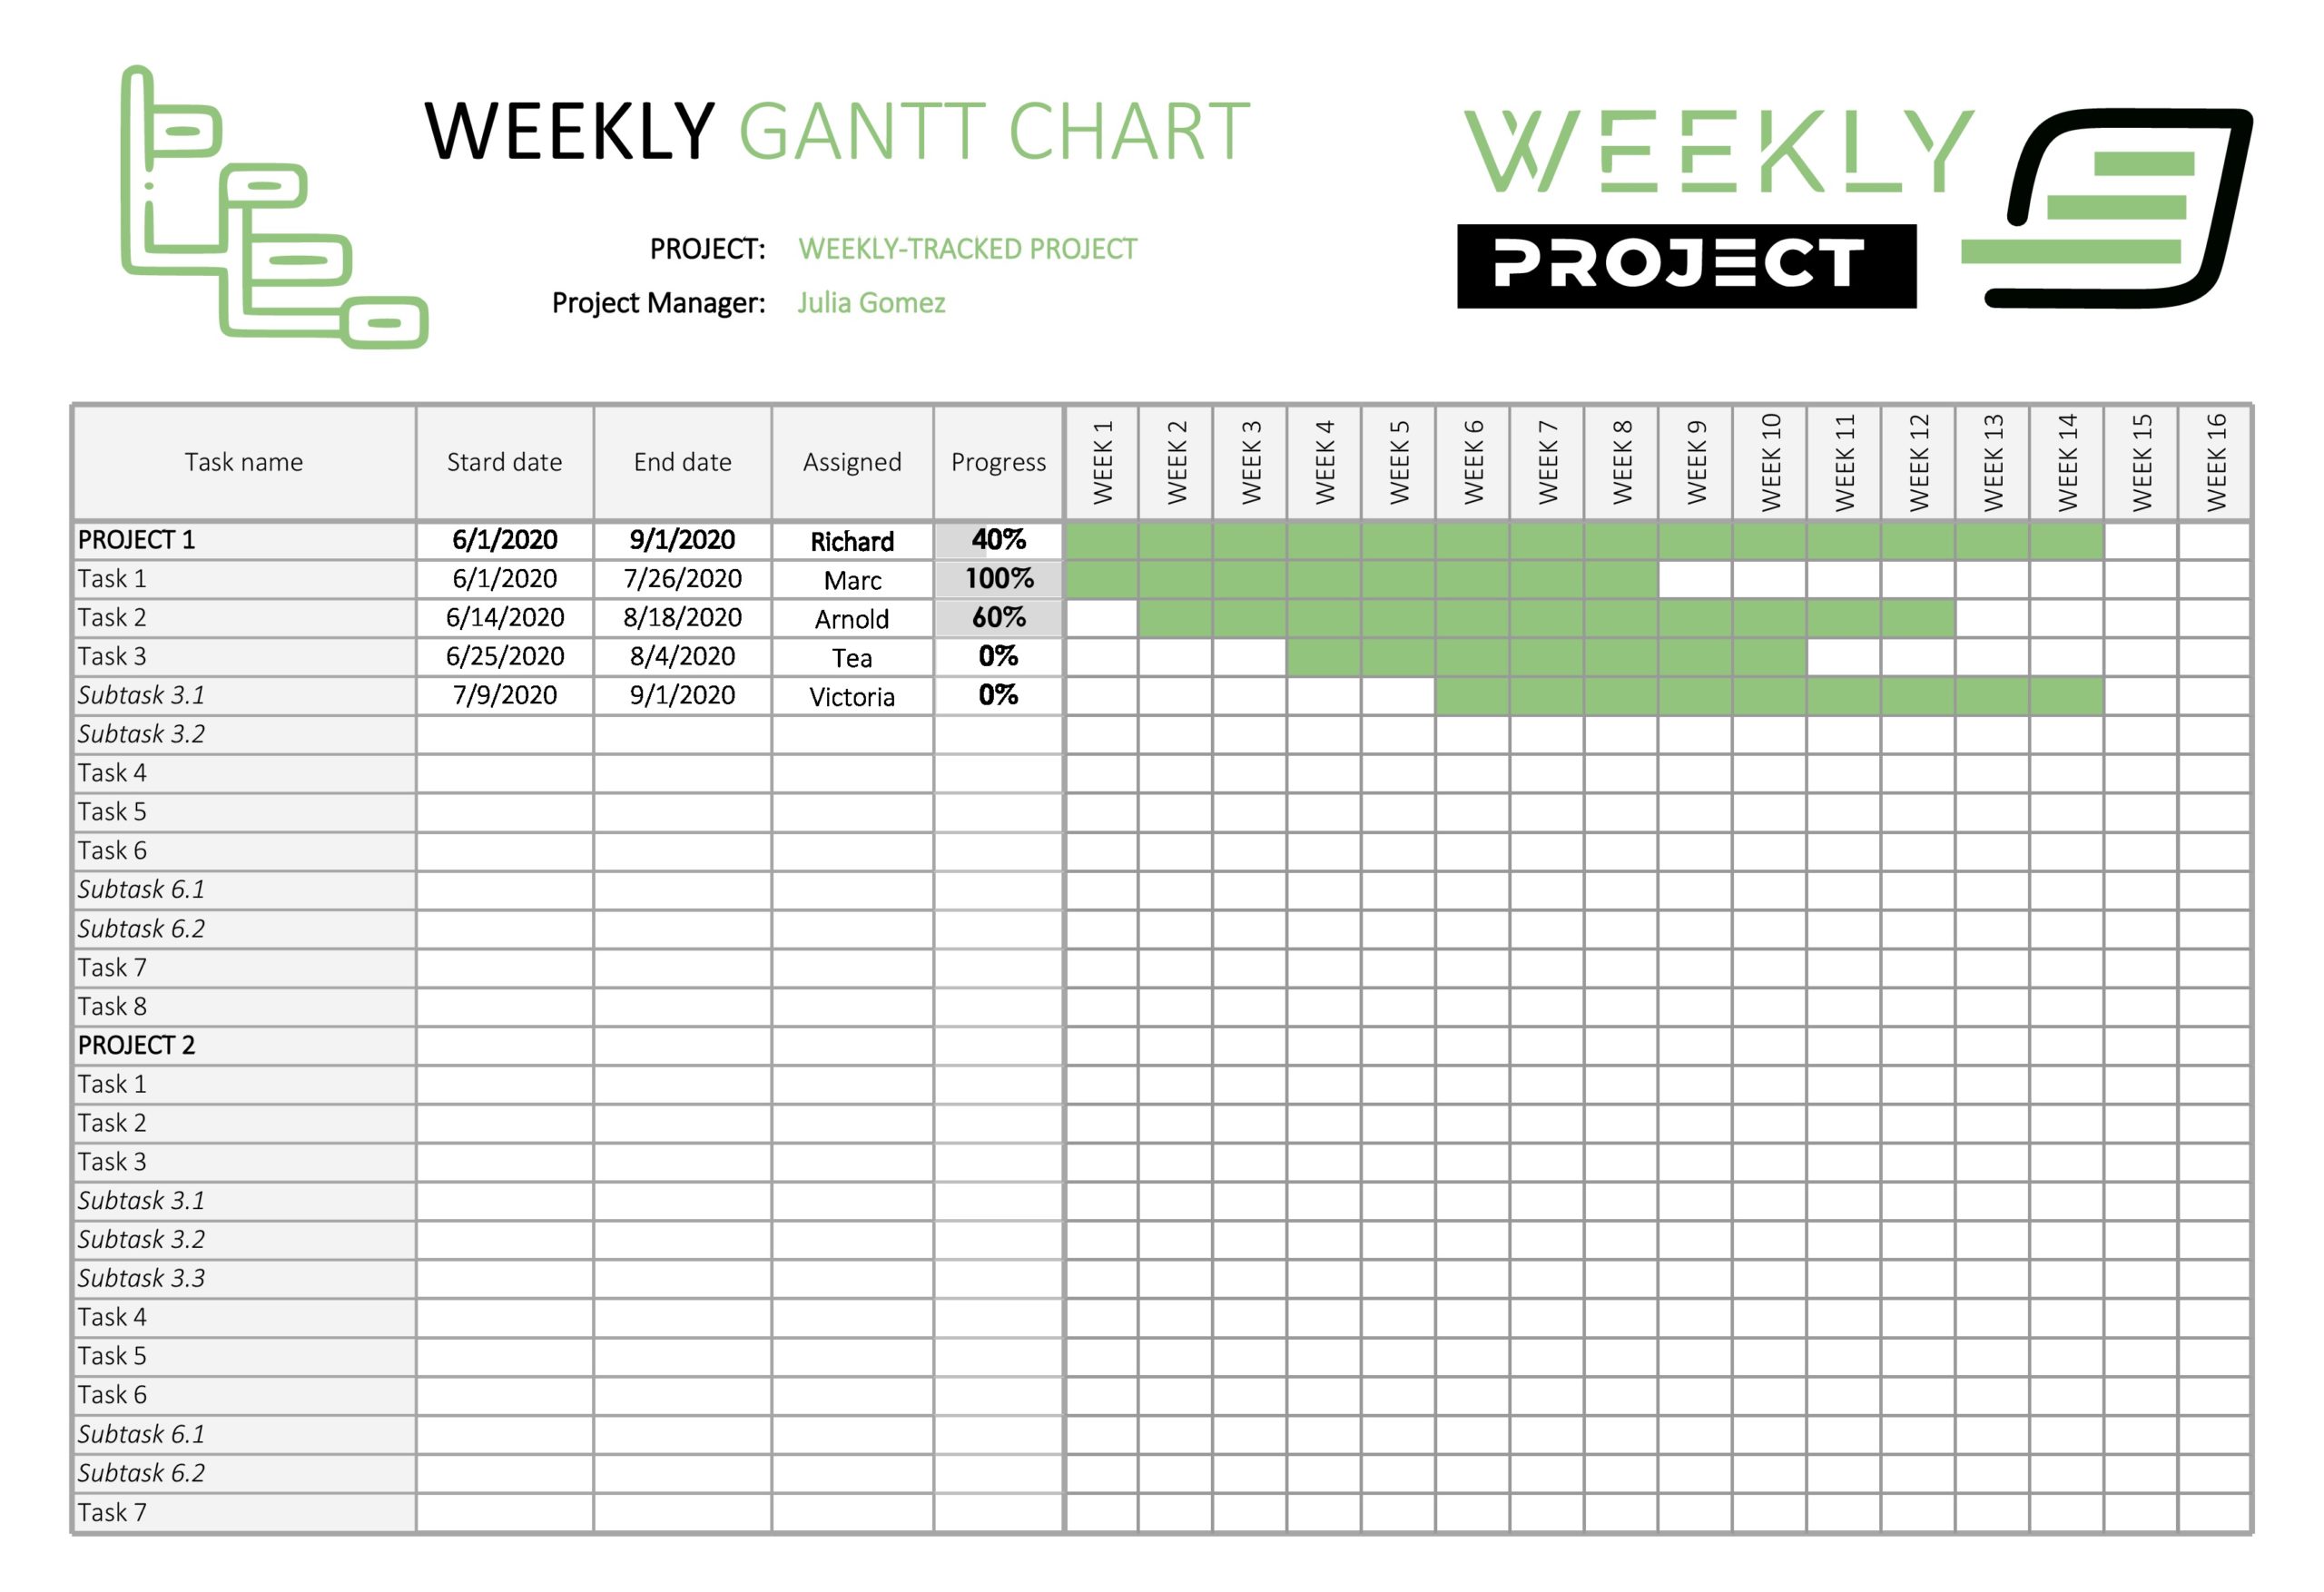
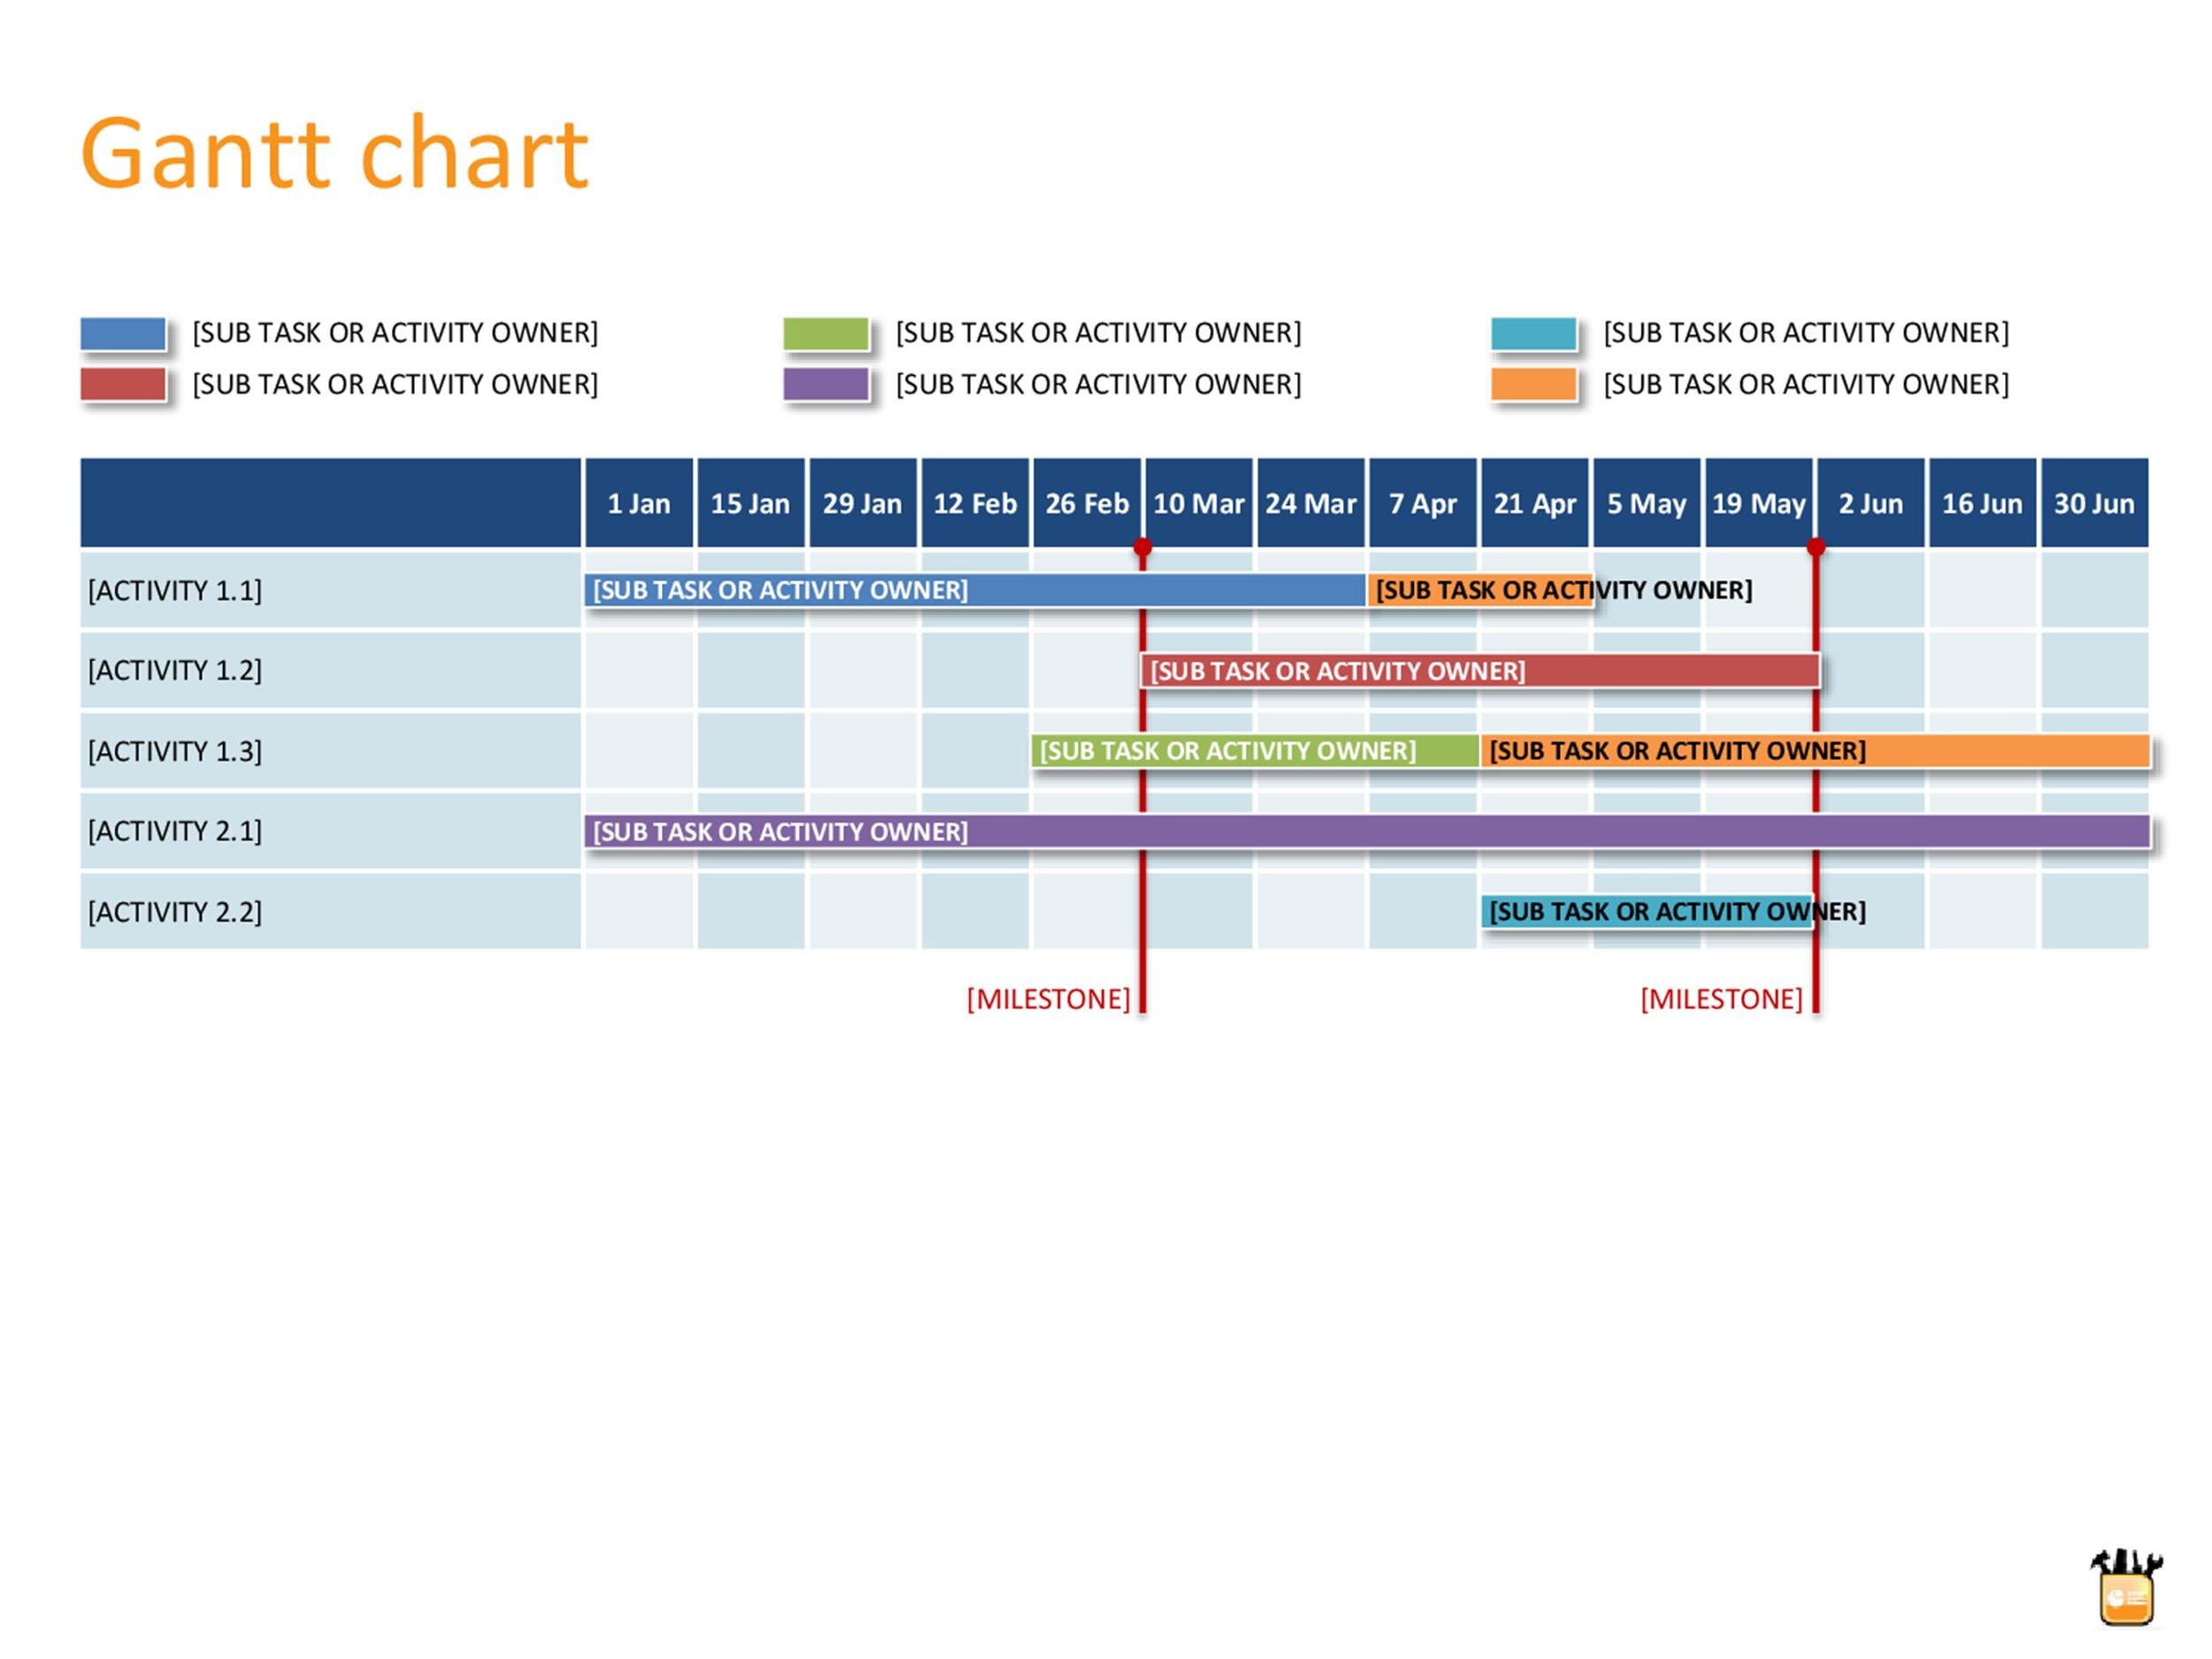
How to Create a Gantt Chart
Creating a Gantt chart is a straightforward process that can be done using various tools and software available online. Here are some simple steps to help you create a Gantt chart for your project:
1. Define Your Project Scope: Clearly define the objectives, tasks, and deliverables of your project.
2. List Tasks and Dependencies: Create a task list and identify dependencies between tasks.
3. Estimate Task Durations: Estimate the duration of each task and allocate resources accordingly.
4. Choose a Tool: Select a Gantt chart tool or software that suits your project management needs.
5. Input Data: Enter your task list, durations, dependencies, milestones, and resources into the Gantt chart tool.
6. Customize the Chart: Customize the chart layout, colors, and formatting to make it visually appealing and easy to understand.
7. Monitor and Update: Regularly monitor and update the Gantt chart to track progress, adjust timelines, and communicate changes to your team.
By following these steps, you can create an effective Gantt chart that will help you plan, manage, and track your projects more efficiently.
Tips for Using Gantt Charts
To make the most of Gantt charts in your project management process, consider the following tips:
– Keep It Updated: Regularly update your Gantt chart to reflect changes in task timelines, dependencies, and resource allocations.
– Communicate Effectively: Use the Gantt chart as a communication tool to keep your team members and stakeholders informed about project progress.
– Monitor Progress: Track task progress and milestones to ensure the project stays on schedule and within budget.
– Identify Critical Path: Identify the critical path in your project schedule to pinpoint tasks that must be completed on time to avoid delays.
– Collaborate with Your Team: Encourage collaboration among team members by sharing the Gantt chart and inviting feedback and input.
– Use Color Coding: Use colors to differentiate between task types, priorities, or team members for better visualization.
– Set Realistic Deadlines: Ensure that deadlines are realistic and achievable to prevent overloading team members and causing burnout.
By incorporating these tips into your project management practices, you can leverage the power of Gantt charts to improve efficiency, productivity, and success in your projects.
Gantt Chart Template – Download
