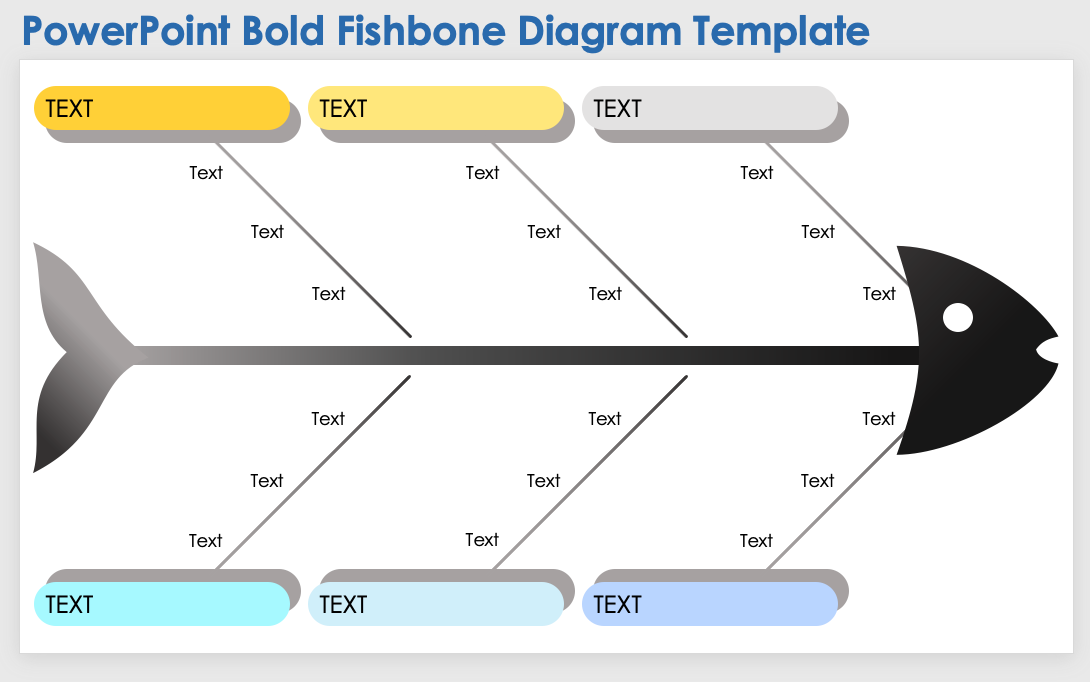
When it comes to process improvement and problem-solving, the Ishikawa chart, also known as a fishbone diagram or cause-and-effect diagram, is a powerful tool that can help organizations identify root causes of issues and develop effective solutions. Originally developed by Kaoru Ishikawa, a Japanese quality control expert, this visual tool has become a staple in various industries for its simplicity and effectiveness in analyzing complex problems.
What is an Ishikawa Chart?
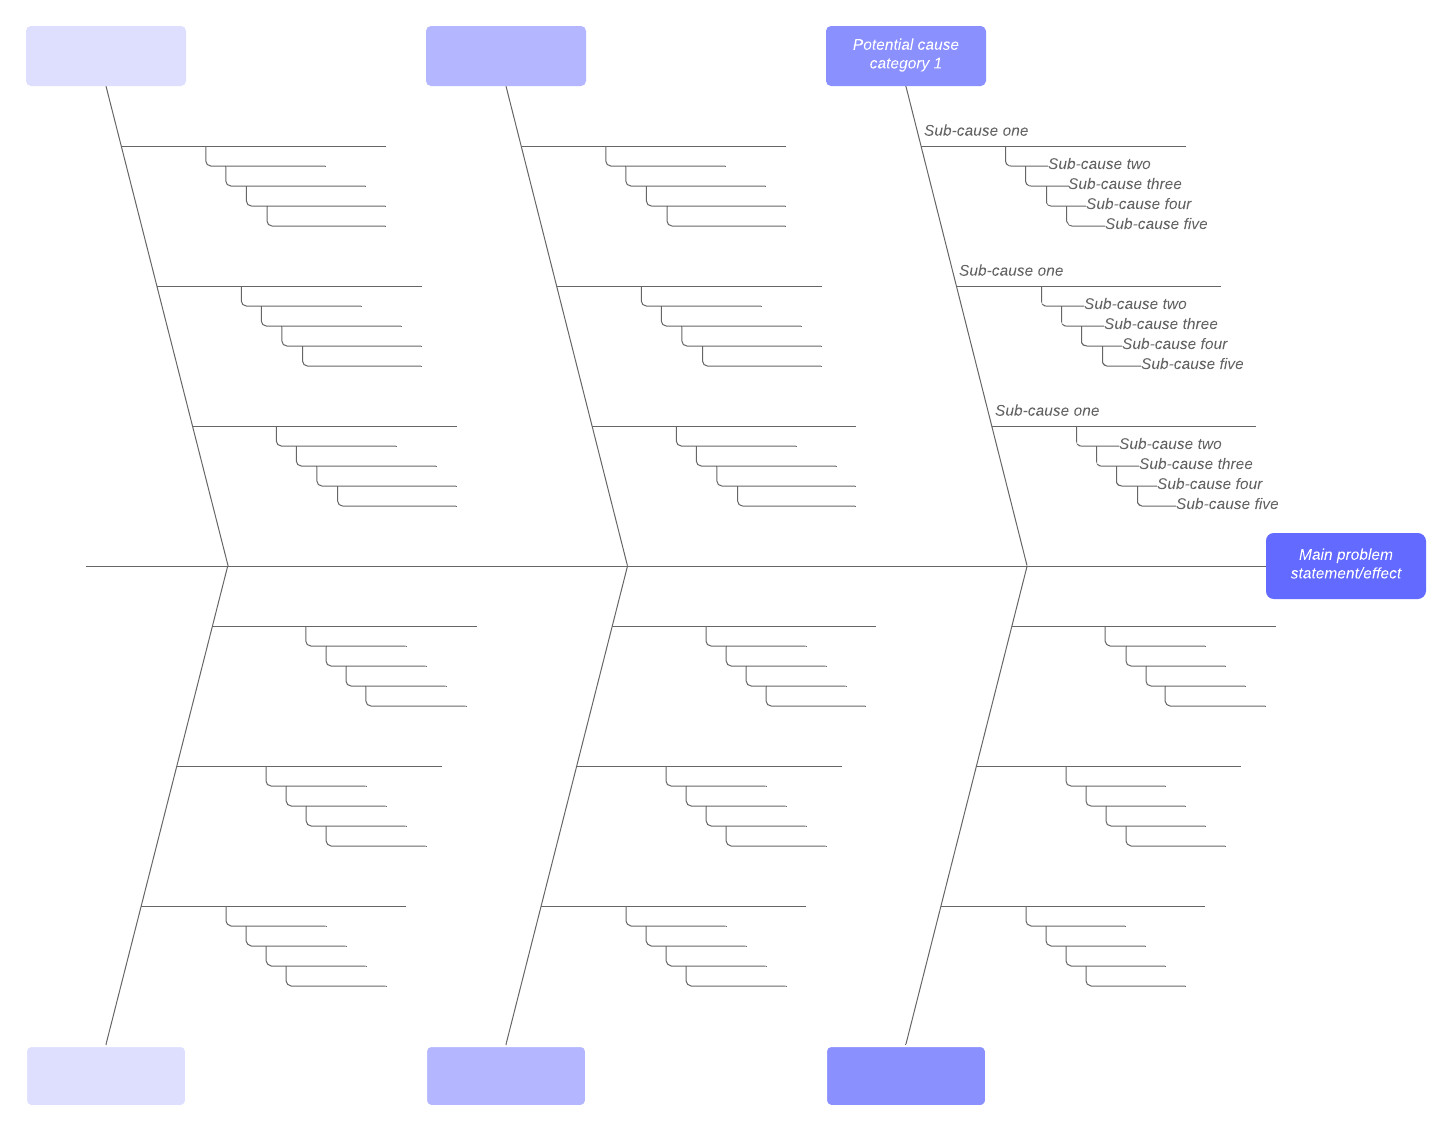
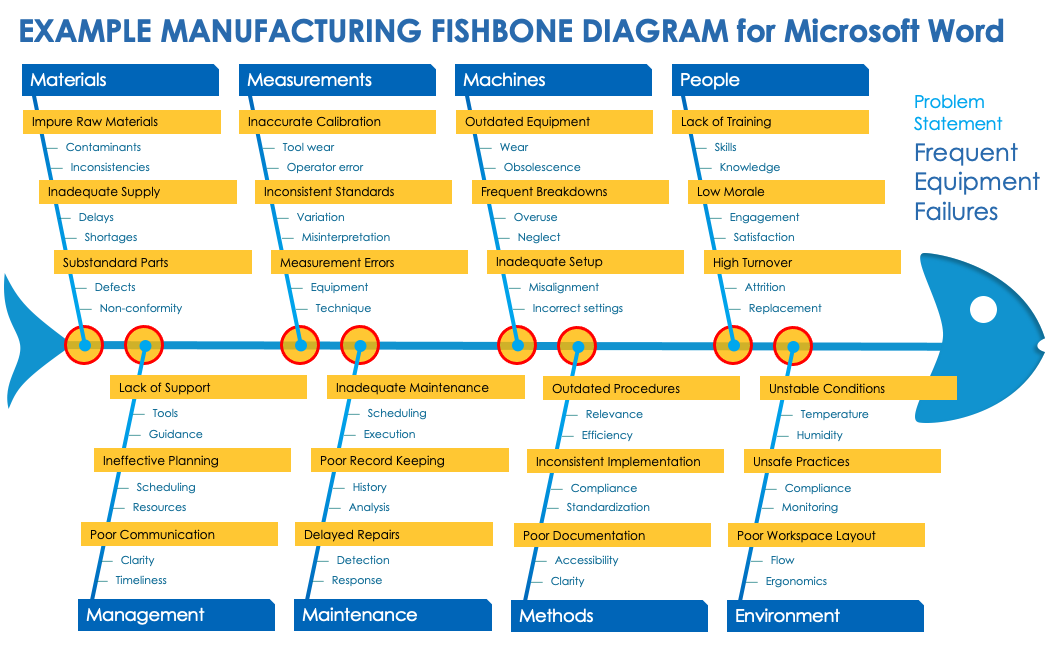
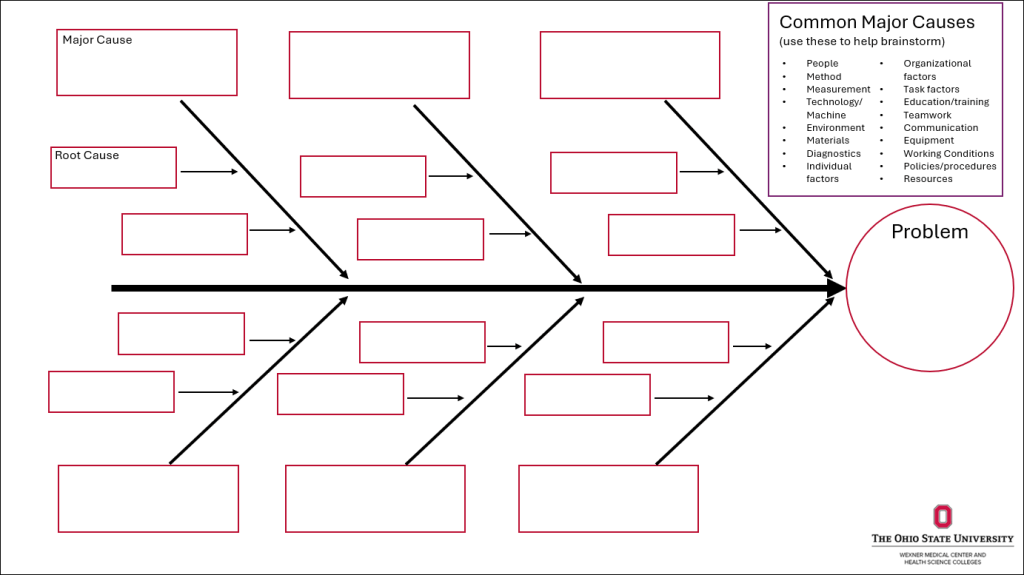
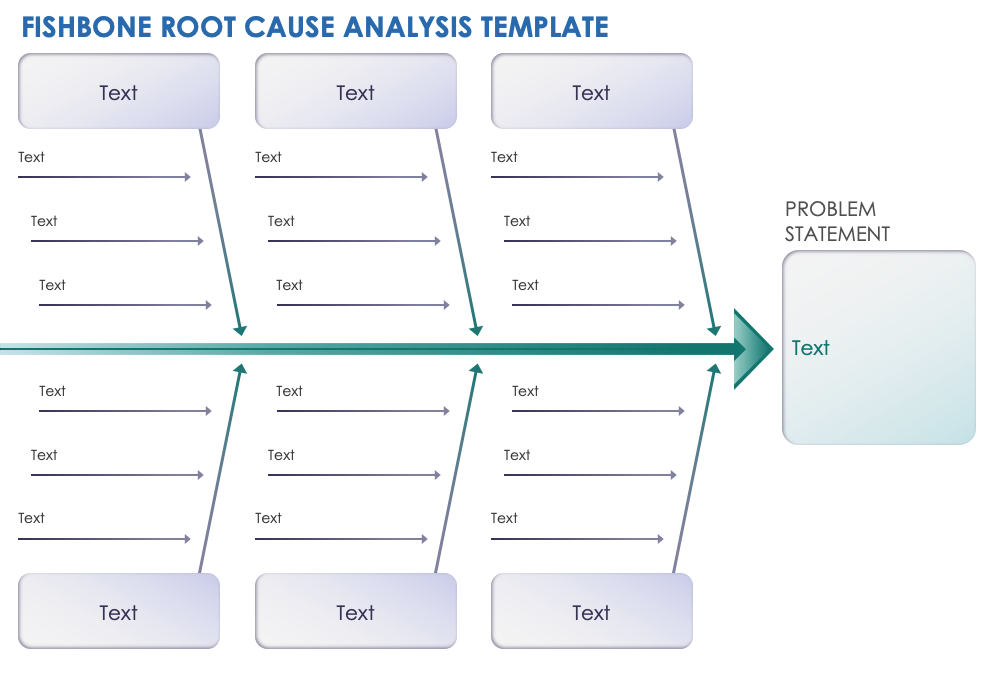
An Ishikawa chart is a visual tool used to identify and categorize potential causes of a specific problem or effect. The chart is structured like a fishbone, with the problem or effect being the “head” of the fish and the potential causes categorized into different branches. By visually representing the relationship between the effect and its possible causes, teams can systematically analyze the root causes of a problem and generate solutions to address them.
Key Components of an Ishikawa Chart:
- Head: The main problem or effect that needs to be addressed.
- Categories: The main branches representing different categories of potential causes (e.g., people, process, equipment, materials).
- Subcategories: Further breakdown of causes under each category to provide more detailed analysis.
- Causes: Specific factors or reasons that may contribute to the problem.
Why Use an Ishikawa Chart?
An Ishikawa chart offers several benefits for organizations looking to improve processes and solve problems efficiently:
- Visual Representation: The visual nature of the chart helps teams better understand the relationship between the problem and its causes.
- Systematic Analysis: By categorizing causes into different branches, teams can systematically analyze and prioritize potential root causes.
- Collaborative Tool: The chart encourages team collaboration and brainstorming, leading to diverse insights and perspectives.
- Data-Driven Decisions: The chart helps teams make informed decisions based on data and evidence rather than assumptions.
What to Include in an Ishikawa Chart?
When creating an Ishikawa chart, it’s important to include the following elements to ensure a comprehensive analysis:
- Clearly Defined Problem: Start by clearly defining the problem or effect that needs to be addressed.
- Categories and Subcategories: Identify and categorize potential causes into main branches and subcategories for a structured analysis.
- Potential Causes: List down specific factors or reasons that could contribute to the problem under each category.
- Data and Evidence: Gather relevant data and evidence to support the identified causes and validate the analysis.
- Team Collaboration: Involve team members from diverse backgrounds and expertise to ensure a comprehensive analysis and brainstorming session.
How to Create an Ishikawa Chart?
Creating an Ishikawa chart involves the following steps:
- Define the Problem: Clearly identify the problem or effect that needs to be addressed.
- Create Categories: Identify main categories of potential causes (e.g., 5 Whys, people, process, equipment).
- Add Subcategories: Break down each category into subcategories for detailed analysis.
- Identify Causes: List down specific causes under each subcategory based on brainstorming and data analysis.
- Draw the Chart: Create the fishbone structure with the problem at the head and causes branching out from the categories.
- Analyze and Prioritize: Review the chart with the team, analyze the causes, and prioritize the most likely root causes.
- Develop Solutions: Based on the analysis, develop solutions to address the root causes and implement them effectively.
Tips for Successful Ishikawa Chart Analysis
Here are some tips to ensure a successful Ishikawa chart analysis:
- Focus on Root Causes: Prioritize identifying and addressing root causes rather than symptoms.
- Collect Data: Gather relevant data and evidence to support the identified causes and validate the analysis.
- Involve Cross-Functional Teams: Include team members from different departments and expertise to gain diverse perspectives.
- Encourage Brainstorming: Foster a collaborative environment that encourages open brainstorming and idea generation.
- Follow Up on Solutions: Implement solutions based on the analysis and monitor the outcomes to ensure effectiveness.
- Continuous Improvement: Use the Ishikawa chart as a continuous improvement tool to address recurring issues and enhance processes over time.
Conclusion
The Ishikawa chart is a valuable tool for organizations seeking to identify root causes of problems, improve processes, and drive continuous improvement. By visually representing the relationship between the problem and its causes, teams can collaborate effectively, prioritize solutions, and make data-driven decisions. With the right approach and mindset, the Ishikawa chart can empower organizations to tackle complex challenges and achieve sustainable results.
